Introduction to Haptik's Intelligent Analytics
- Getting Started
- Bot Building
- Smart Agent Chat
- Conversation Design
-
Developer Guides
Code Step Integration Static Step Integration Shopify Integration SETU Integration Exotel Integration CIBIL integration Freshdesk KMS Integration PayU Integration Zendesk Guide Integration Twilio Integration Razorpay Integration LeadSquared Integration USU(Unymira) Integration Helo(VivaConnect) Integration Salesforce KMS Integration Stripe Integration PayPal Integration CleverTap Integration Fynd Integration HubSpot Integration Magento Integration WooCommerce Integration Microsoft Dynamics 365 Integration
- Deployment
- External Agent Tool Setup
- Analytics & Reporting
- Notifications
- Commerce Plus
- Troubleshooting Guides
- Release Notes
Introduction
Intelligent Analytics by Haptik empowers teams to get a comprehensive overview of how the IVAs are performing. Get in-depth insights into how users interact with your IVAs, identify problem areas or features that can be improved and also collect first-hand user feedback about your IVA experience in real-time. The user messages/conversations with historical data can help answer the toughest questions about users. Boost your IVA's conversations' success with this tool.
This tool consists of multiple sections with each section containing metrics and data about a different aspect of the IVA. The multiple sections include:
- Overview
- Skill Analysis
- Message Analysis
- AI Recommendations
- Word Analysis
- Smart Funnel
- CSAT
Through this document, we shall explore the different types of metrics available for tracking and analyzing the IVA using the real-time Intelligent Analytics tool. You can go through the below introductory video of Intelligent Analytics to take a birds-eye-view of the tool.
Accessing the Tool
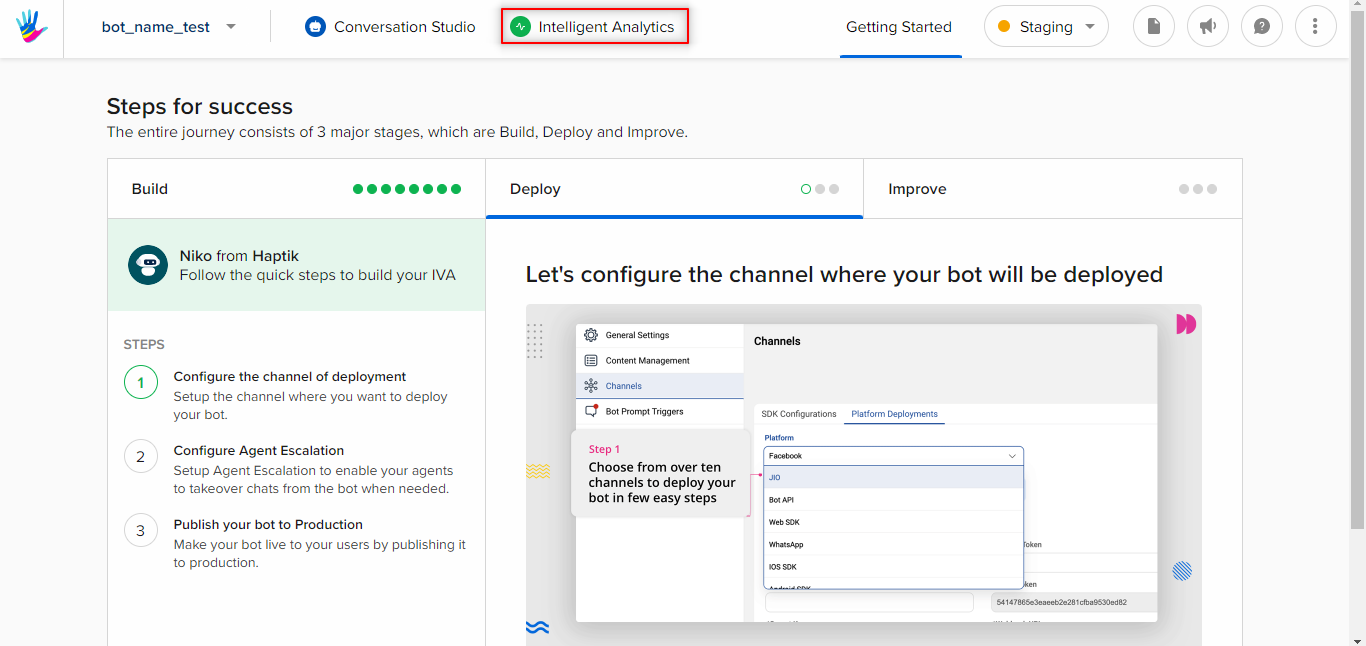
Below is the home screen you will get to see once you have successfully logged-in.

Opening Intelligent Analytics
After you have been presented with the home screen with all the tools you have access to, click on the Intelligent Analytics option to open the analytics tool.
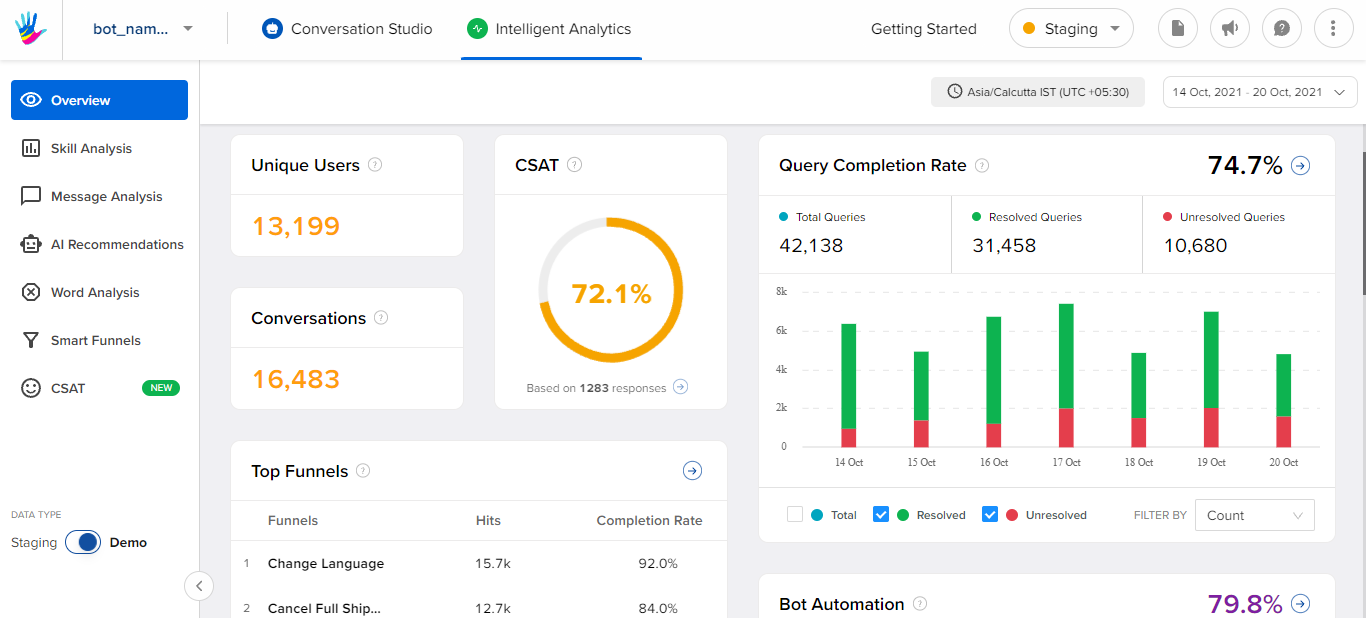
After clicking on Intelligent Analytics you should be able to see the analytics dashboard with a menu to open different parts of the tool.

Now that you can access the tool, you can go through the sections provided in this documentation to know more about the various screens on Intelligent Analytics the tool. You can start here.
There are various metrics related to a bot. To understand each and every metric, you need to go through the data that they represent. If your bot is live for the end-users, you will get to see all the data on the overview page of Intelligent Analytics.
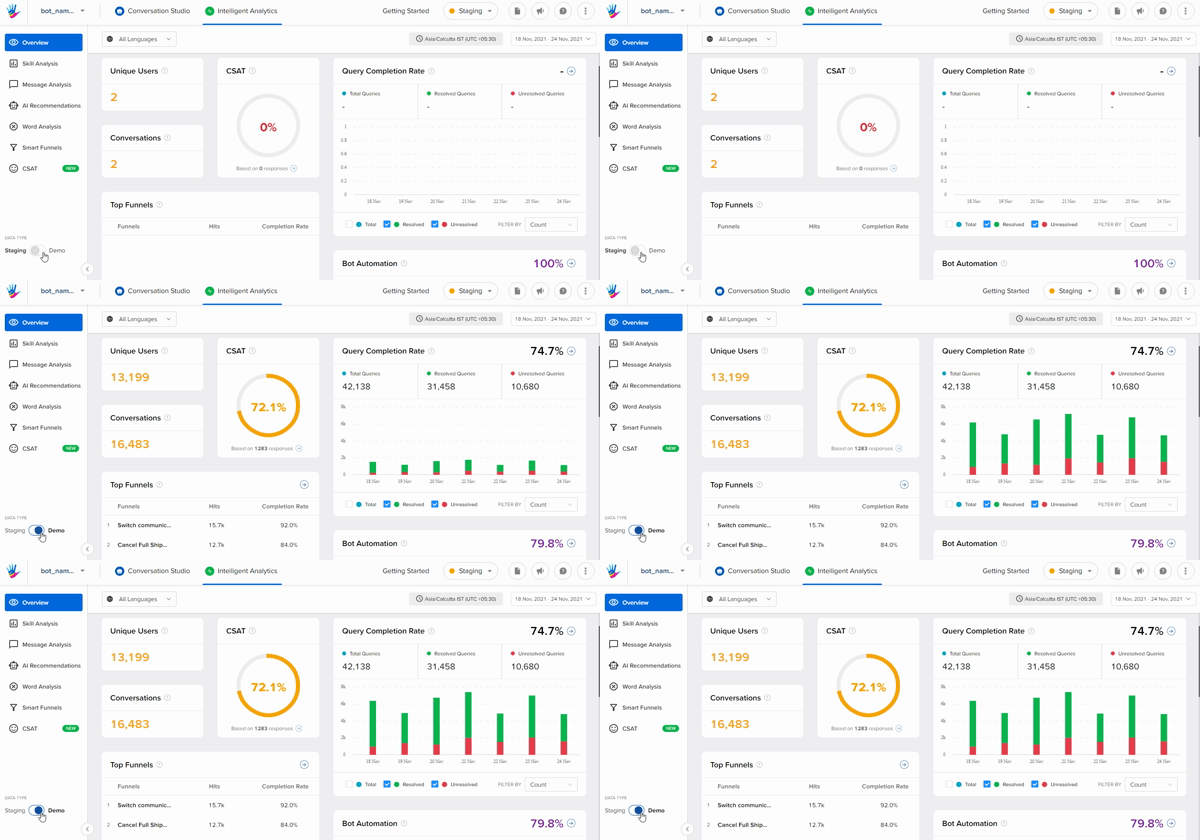
If your bot is new, and if you try to check the analytics metrics, you won't be able to see any data, as there has been no activity of users on your bot. In this case, you can use the Demo data.
What is Demo Data?
At the bottom of the sidebar, you will see a toggle switch. It is used for switching between staging data and demo data. Demo data is data for demonstration purposes, that would give you an idea of each and every metric on the overview page.
You can switch back to staging data, again by selecting the toggle switch.

