What is Bot Automation?
- Getting Started
- Bot Building
- Smart Agent Chat
- Conversation Design
-
Developer Guides
Code Step Integration Static Step Integration Shopify Integration SETU Integration Exotel Integration CIBIL integration Freshdesk KMS Integration PayU Integration Zendesk Guide Integration Twilio Integration Razorpay Integration LeadSquared Integration USU(Unymira) Integration Helo(VivaConnect) Integration Salesforce KMS Integration Stripe Integration PayPal Integration CleverTap Integration Fynd Integration HubSpot Integration Magento Integration WooCommerce Integration Microsoft Dynamics 365 Integration
- Deployment
- External Agent Tool Setup
- Analytics & Reporting
- Notifications
- Commerce Plus
- Troubleshooting Guides
- Release Notes
Bot Automation
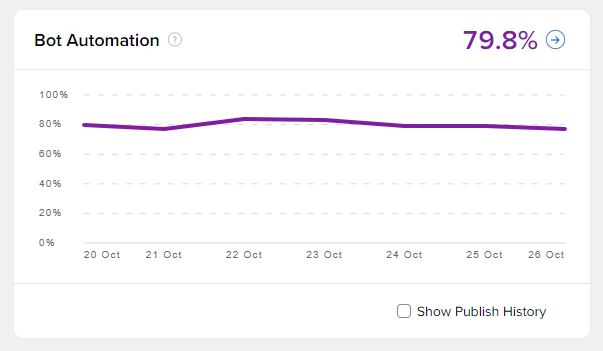
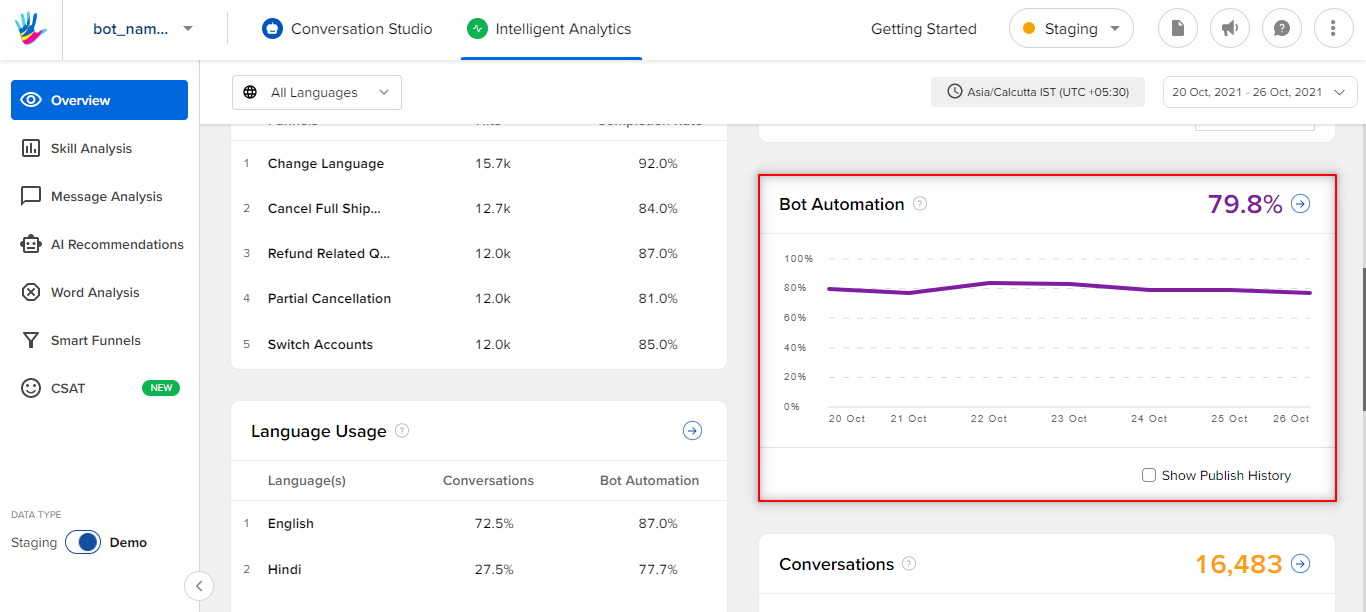
The next section is Bot Automation. Bot Automation percentage tells us about what percentage of the conversations did not have either a bot break or an agent involved for the selected duration of time.

In the graph, the X-axis represents the selected time range and the Y-axis represents Bot Automation %.

Starting 1st September 2021, this formula does not count conversations as automated where -
- Agent was online but did not send an agent response
- Agent was offline and the conversation was auto-completed
Below are the scenarios where bot breaks could take place -
Scenario 1:When a bot fails to answer a query that it was trained on
Scenario 2:When there is an API failure and the bot is not able to give an appropriate response
Scenario 3:When a conversation gets transferred to an agent from a bot
When a bot gives a smart assist message, it is not considered a Bot Break. You can read more about Smart Assist and its types here.
As we do not count Smart Assist as a broken message. In case you want to access these messages, you can follow the below stages-
- Click on the Message Analysis section
- Use the Confidence Score toggle to find the below messages
- 0-30 for Bot Break and Smart Assist messages
- Above 30 for all other messages

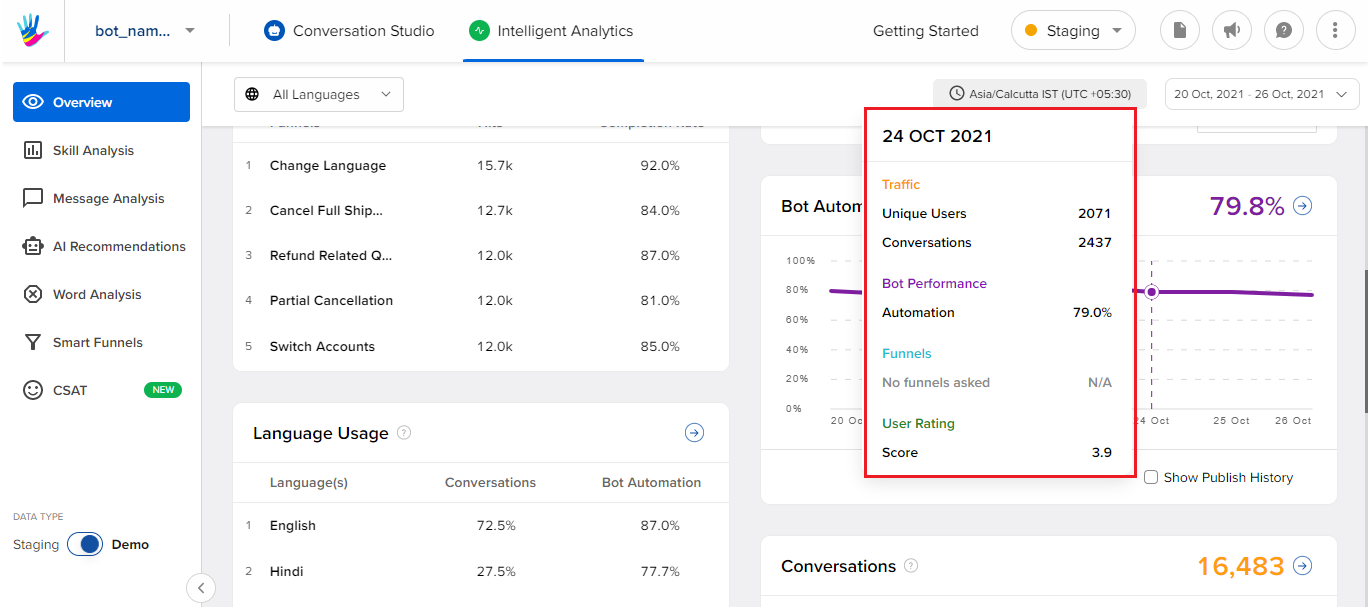
You can view data by hovering over the graph at the selected point of date-time.

Traffic: It will give the number of unique users and conversations.
Bot Performance: It will give the Bot Automation %.
Funnels: It will give the top queries asked by users.
User Rating: It will give the average of user ratings given.
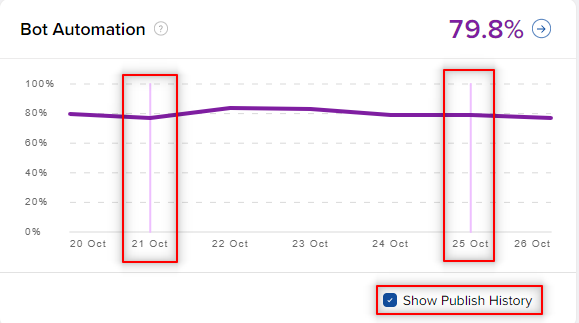
Show Publish history
 Bot Publishing is shown on the graph too with a vertical line along with a toggle filter to see the details with and without. Checking these lines on the graph will help us understand if there have been any changes in the bot's performance due to the bot publishing.
