How to get Brand Insights on Tableau?

Written by Soham Amburle
Updated on June 17th, 2022
- Getting Started
- Bot Building
- Smart Agent Chat
- Conversation Design
-
Developer Guides
Code Step Integration Static Step Integration Shopify Integration SETU Integration Exotel Integration CIBIL integration Freshdesk KMS Integration PayU Integration Zendesk Guide Integration Twilio Integration Razorpay Integration LeadSquared Integration USU(Unymira) Integration Helo(VivaConnect) Integration Salesforce KMS Integration Stripe Integration PayPal Integration CleverTap Integration Fynd Integration HubSpot Integration Magento Integration WooCommerce Integration Microsoft Dynamics 365 Integration
- Deployment
- External Agent Tool Setup
- Analytics & Reporting
- Notifications
- Commerce Plus
- Troubleshooting Guides
- Release Notes
Analyzing business-related insights are required to have a deep understanding of your customers, their behaviors, their preferences, and even their needs. When you have a bot that enables interaction with your customers, it is imperative for you to analyze data captured on your bot, as it tells you a lot about customer behavior towards your product or service and how effective the bot is at handling customer queries. This is where Brand Insights will help you.
You can use Brand Insights to plug and play data on the analytics tool of your choice like Tableau, Power BI, etc. to get a deeper understanding of the Conversational AI solution. Brand Insights can cover data around ROI metrics, Business related metrics, and others of the like.
This article would talk about the integration we have created of Tableau and Haptik. This will enable teams from your business to import bot-related metrics from Haptik into Tableau. You can then analyze and study this data to easily correlate data points and also have a check on your bot's performance.
ROI Metrics
You can measure the value that your Conversational AI solution brings to your business & track ROI-related metrics like Cost Saved, Leads Generated, ROI, etc. using Brand Insights. Let us understand how to set up and use these ROI-related metrics.
Prerequisites for Tableau and Haptik integration
- Tableau Licenses. 1 Creator and 1 Explorer license is a must. You can read more about it, here.
- JDBC driver is required for establishing a connection with Tableau.
- Basic understanding of using Tableau as a Business Intelligence tool
- S3 bucket where Haptik can pass CSV files on a regular basis using Data Export. You can read more about it, here.
Set up Tableau and Haptik integration
Setup is divided into three sections:
- Enable Integration on Haptik's Intelligent Analytics dashboard
- Connect S3 with the Tableau account using Amazon Athena
- Download the sample Tableau dashboard & replace the data source
Let’s go through each of these sections in detail.
1. Enable Integration on the Intelligent Analytics dashboard
Step 1: You need to open your bot on Haptik and navigate to Intelligent Analytics > Integrations, where you will have to select Tableau, as shown.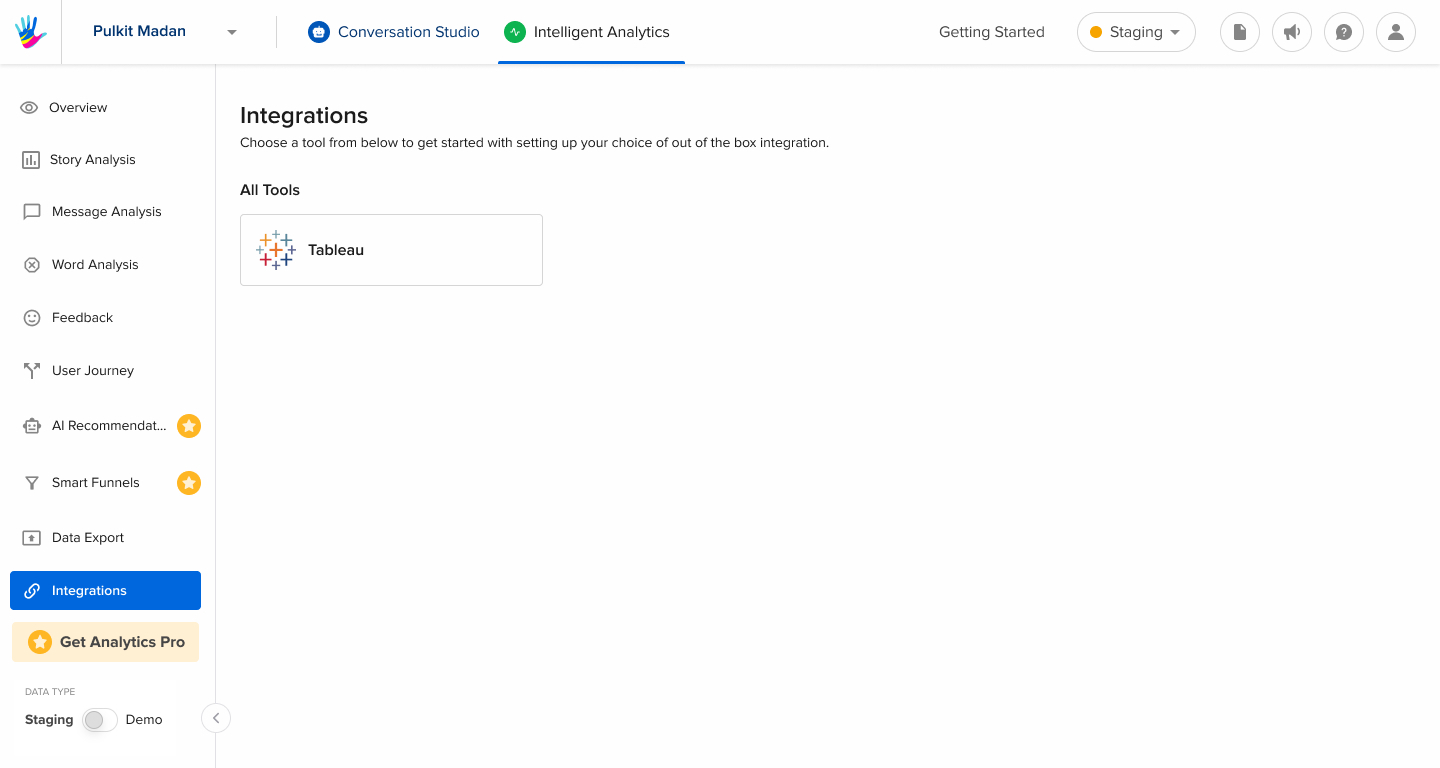
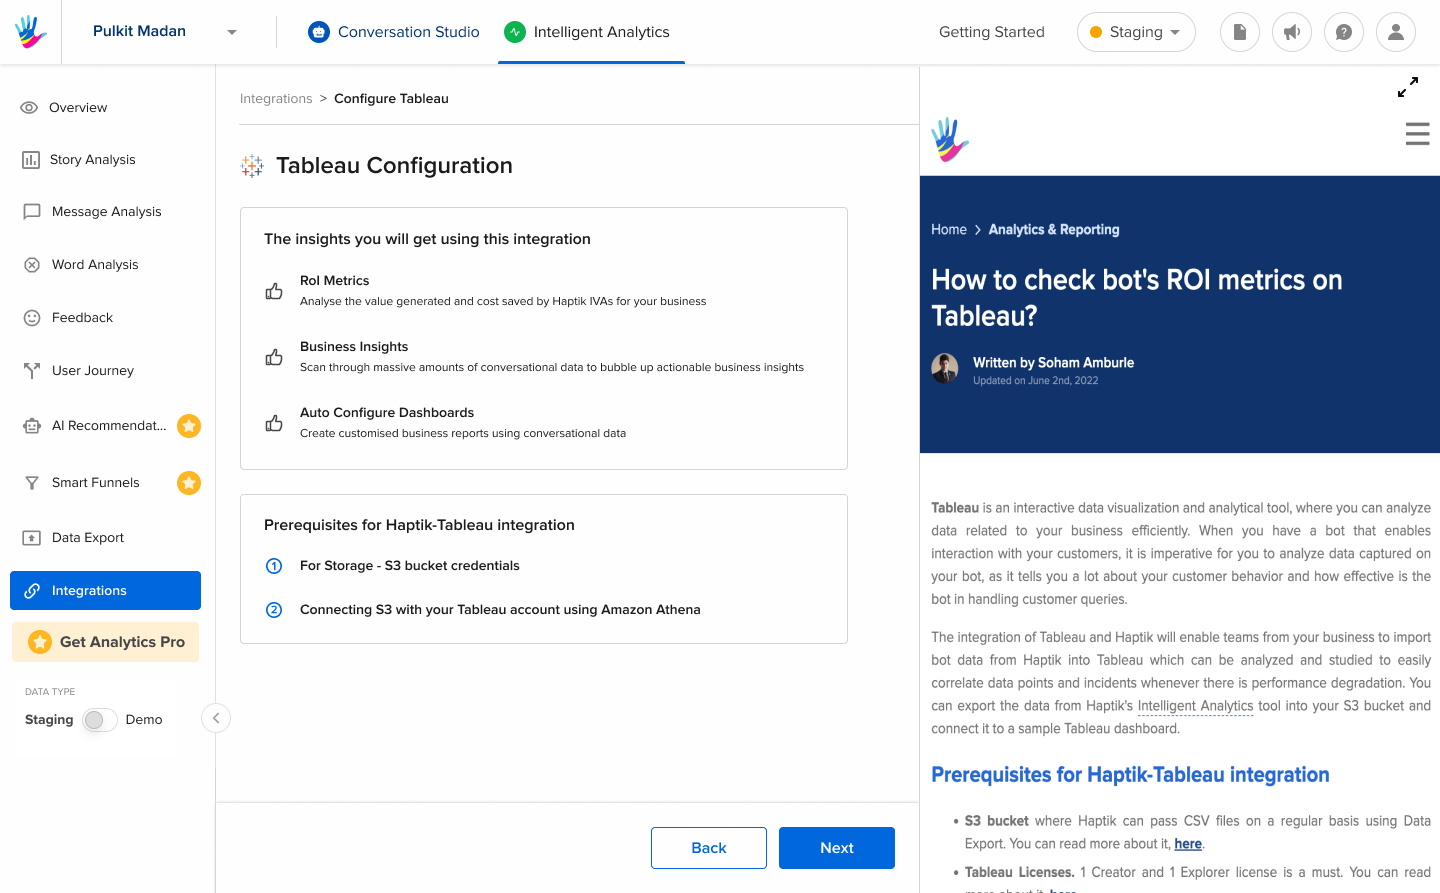
Step 2: After clicking on Tableau, you will be taken to the details page which talks about the insights available after this integration has been enabled, particularly ROI Metrics and Business Insights. After reading this, you can click on the Next button.
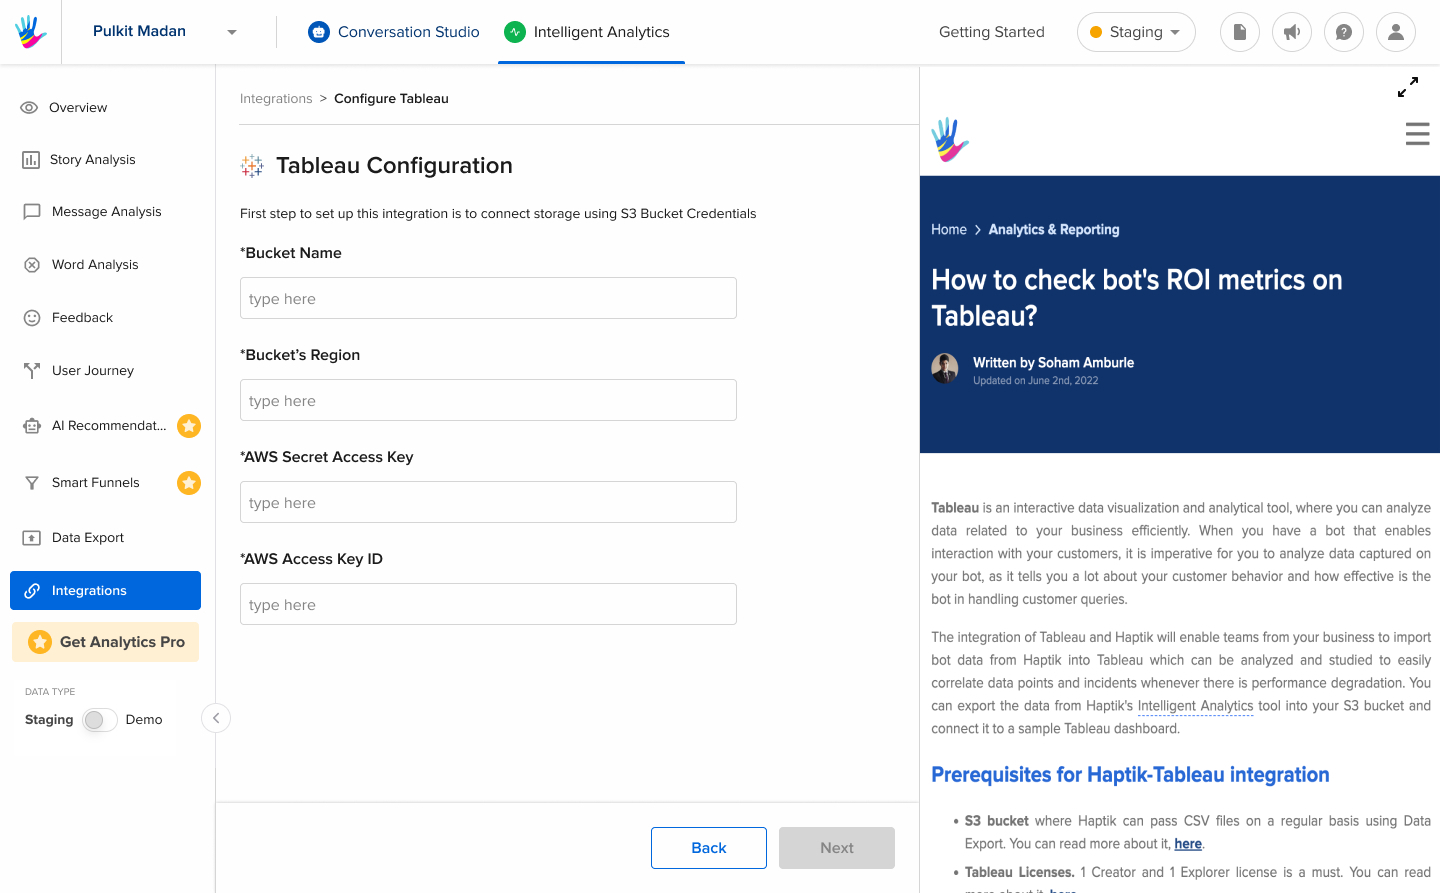
Step 3: Here, you will be asked to enter your S3 Bucket Credentials, as shown
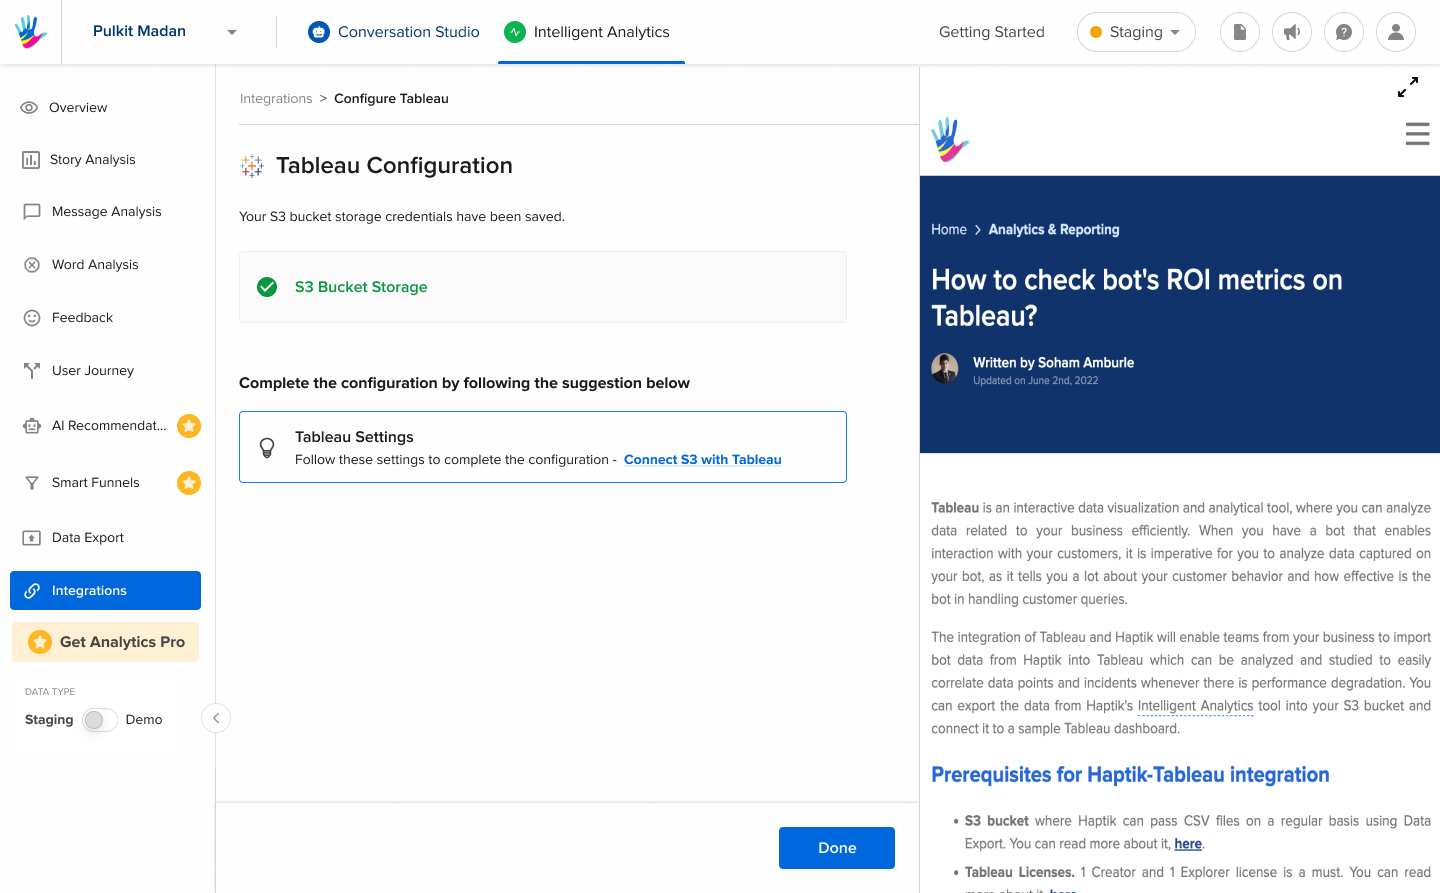
Step 4: Once S3 Bucket Credentials are successfully verified, the data from the Intelligent Analytics dashboard will start flowing to your AWS Cloud Storage.
2. Connect S3 with your Tableau account using Amazon Athena
Once the CSV files start getting pushed into your S3 Bucket, go to Athena on your Amazon AWS account and create a table using these sample definitions. After you have created this table, you can now start connecting this S3 Bucket as a data source for your Tableau account using Amazon Athena Connector.
Follow the step-by-step instructions below to establish this connection.
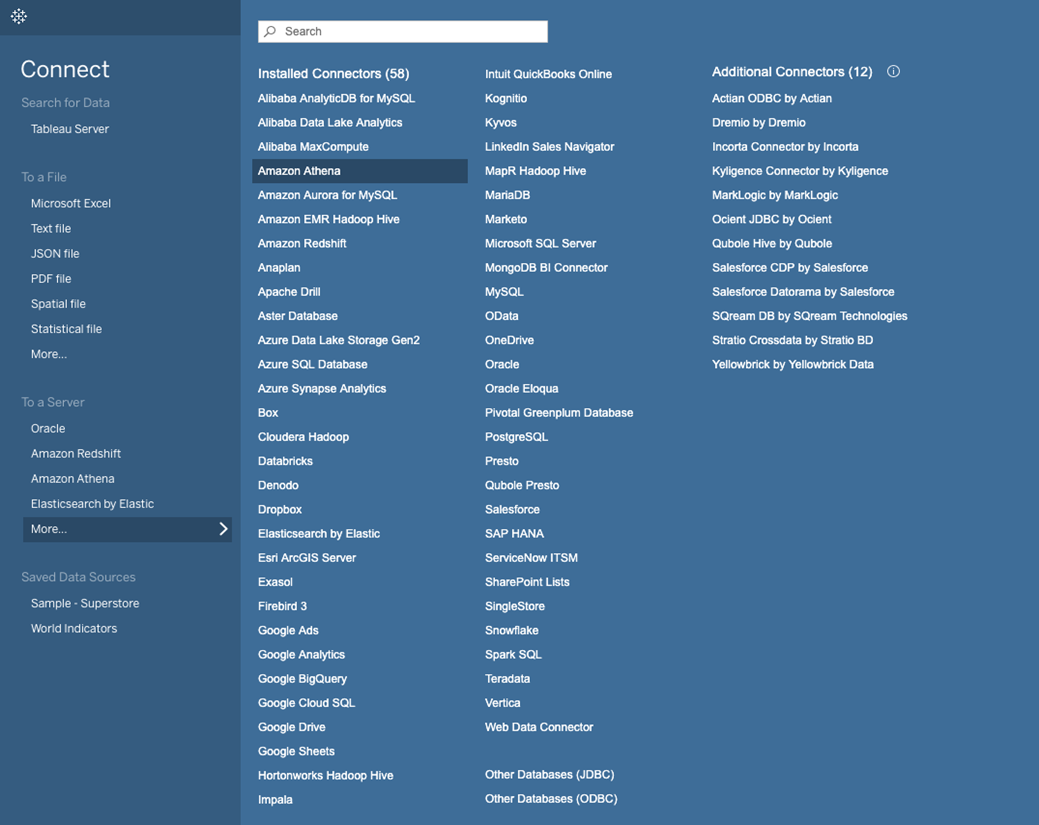
Step 1: Navigate to your Tableau account > Connect > To a Server and connect it with Amazon Athena, as shown.
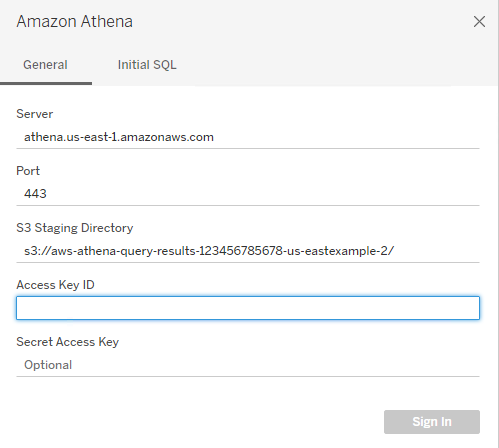
Step 2: Once you have selected Amazon Athena, the following dialog box will open up, where you need to fill in the below details and sign in.
- Server: athena.region.amazon.com (for example, athena.us-east-1.amazonaws.com)
- Port: 443 SSL by default
- S3 Staging Directory: You will get this in the AWS console for Amazon Athena. AWS calls this property “Query Result Location”
-
Access Key ID: Access Key ID is associated with the IAM user you are logging in as.
Step 3: Once you have filled in all the above details and have signed in, you will be able to see the database and tables that are created in Athena. You should be able to see tables after selecting Settings, as shown.
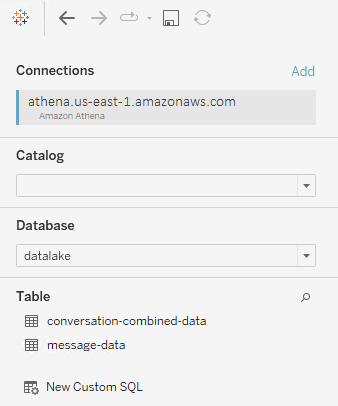
Step 4: You need to make sure that the tables have accurate data in them. You can check tables connected in the sample dashboard in the below image.
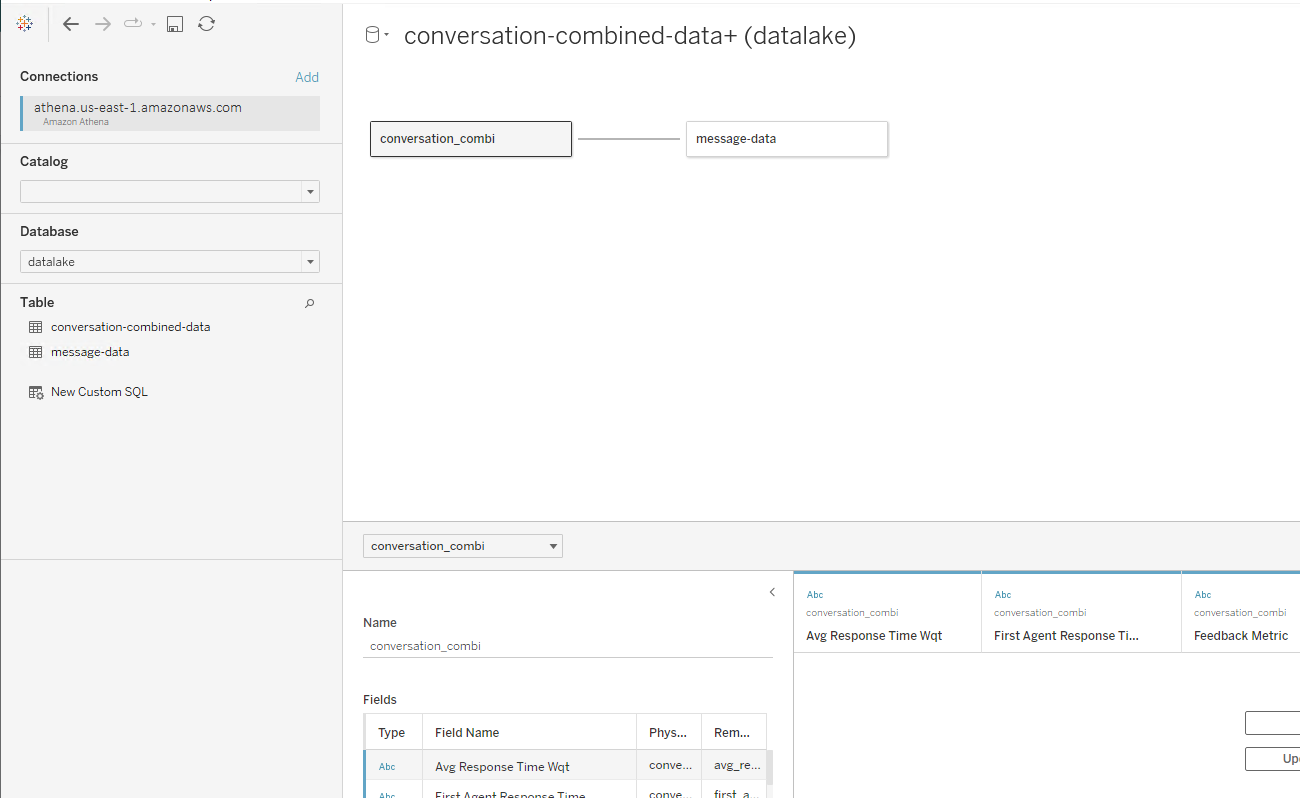
Once the data is loaded, you can also create the Sheets and Dashboard. To make things easy to use, we have already created a Sample dashboard that you can refer to in the next section.
3. Download the sample Tableau ROI Metrics dashboard & replace the data source
You can download the sample dashboard from here. It is already connected to a similar data source connected via the Amazon Athena connector. You can now simply right-click on the tables and click on Edit connection or remove the data sources completely from the dashboard.
Once you have established the connection pointing to your own S3 bucket, the dashboard should update the numbers for your business. The sample ROI dashboard calculates different performance metrics along with insights into ROI.
The section below highlights how each metric is calculated and how you can apply different filters to generate valuable insights and actionable steps.
How to make use of the ROI Dashboard
In order to use the ROI Dashboard on Tableau, let’s first start by reviewing some metrics involved.
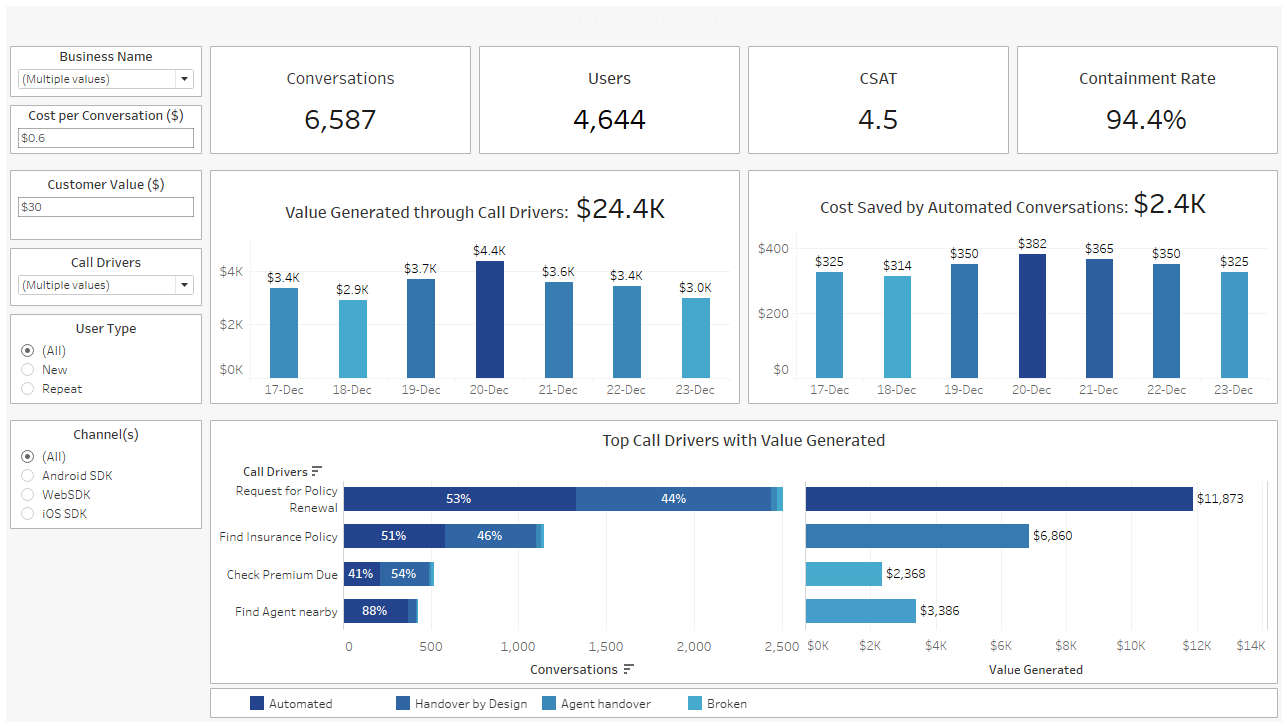
1. Key performance metrics
The uppermost section on the dashboard provides key performance metrics relevant to any business.
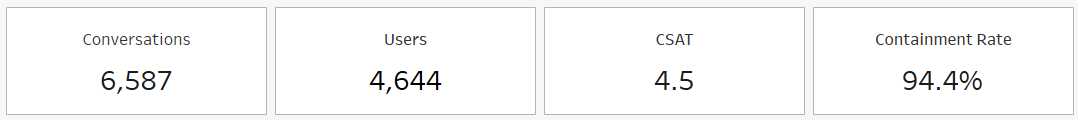
The list below details how each metric is calculated:
-
Conversations = COUNTD([conversation_identifier])
Each conversation on Haptik’s database has a conversation identifier. This is reflected in the ‘Conversation Identifier’ field in the conversation details table. To calculate the total number of conversations, simply count the total number of distinct conversation identifiers. -
Users = COUNTD([user_id])
Similar to the Conversations, users are identified with the help of the ‘Collection ID’ field. We count the distinct number of collection IDs to get the total number of users. -
CSAT = AVG([feedback_rating])
CSAT is collected on Haptik bots in the form of a Feedback Smart Skill where we collect the rating on a scale of 1-5. Once we collect the rating, this rating is then converted into a % based out of 100 using simple extrapolation. This is reflected in the ‘Feeback Rating’ field. -
Containment rate = { FIXED [botbreak], [conversation_identifier]: MAX(IF [botbreak] = TRUE then 1 else 0 end)}/COUNTD([conversation_identifier])
It is the percentage of conversations that did not break. These conversations were either handled end-to-end by the bot or were smoothly transitioned to an agent for resolution.
2. Cost Saved
Cost Saved gives visibility into the cost saved in acquiring new users leveraging the automated workflows on the bot. 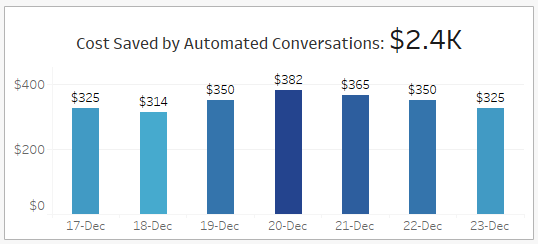
The cost saved is calculated on acquisition using the following logic:
-
Cost Saved = [Automated Coversations]*[Cost per contact]Cost Saved is an adjustable parameter where you can change the value of CPC on the top right section of the dashboard. Currently, the dashboard allows for a single CPC value to be adjusted.
To calculate the automated conversations, we make use of the ‘End-to-End Bot Chat’ field. This field will showcase ‘Y’ only if the conversation was completely handled by the bot. Below is the formula for the same.
Automated Conversations = { FIXED [end_to_end_gogo_chat], [conversation_identifier]: MAX(IF [end_to_end_gogo_chat] = "Yes" THEN 1 ELSE 0 END)}
3. Leads Generated
Leads Generated(also called the value generated through top call drivers) gives visibility into the cost saved in acquiring new users, leveraging the automated workflows on the bot. 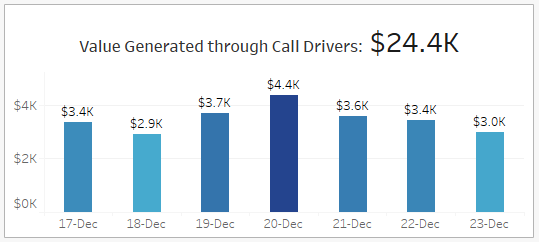
We calculate the cost saved on acquisition using the following logic:
Leads generated = [Automated Conversations]*[Customer Value]*[Query Completion Rate]
Automated Conversations = { FIXED [end_to_end_gogo_chat], [conversation_identifier]: MAX(IF [end_to_end_gogo_chat] = "Yes" THEN 1 ELSE 0 END)}
Query Completion Rate = SUM(total_resolved_flows) / SUM(total_flows)
4. Breakdown of Top Call Drivers
The breakdown of the leads generated (value generated by top call drivers) is shown as a function of the number of conversations and the total value generated by each of these lead generation use-cases. (call drivers)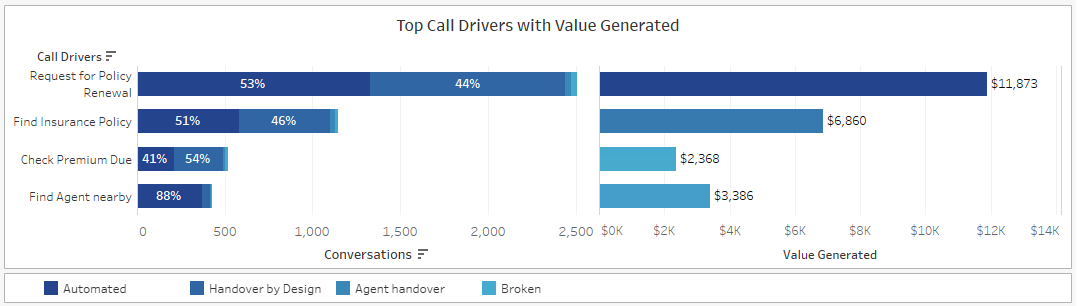
5. Applying filters to deep dive
Additional fields, like the date range, channels, and user type can be used as filters to allow the user to dive deeper into the data. These filters give additional freedom to view the ROI insights on multiple levels of detail.
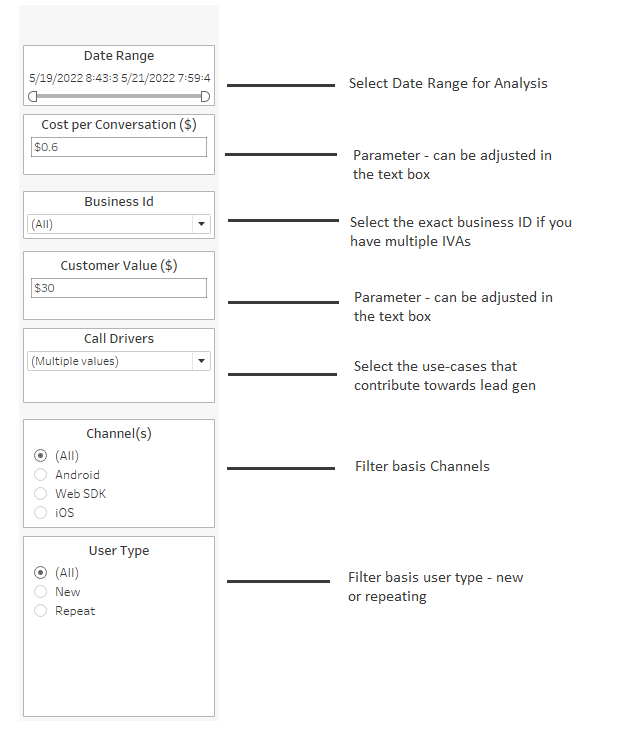
The following list goes through each of these fields in detail:
- Date range: You can set a custom date range using this filter.
- The Cost per Contact and Customer Value are variables that are required to calculate the cost saved and the leads generated respectively. Since these can vary depending on the business, you can input values here based on the nature of your business.
- The Business Id toggle can be used to view the ROI for different IVAs, if a business has deployed multiple IVAs.
- The Channel(s) filter allows you to view the ROI insights for the specific channels where the bots are deployed.
- Lead generation(Call Drivers) use cases are used to filter in only the skillsets that contribute towards any form of business generated (leads generated). These skillsets selected through this filter contribute toward the total leads generated.
-
User Type: This toggle allows you to view the insights segregated by the type of user:
- New: Any user that has a single conversation with any of the bots is termed as a new user
- Repeat/returning: Any user having 2 or more conversations is termed as a repeating user
