How to debug Code step? How to check the logs?
- Getting Started
- Bot Building
- Smart Agent Chat
- Conversation Design
-
Developer Guides
Code Step Integration Static Step Integration Shopify Integration SETU Integration Exotel Integration CIBIL integration Freshdesk KMS Integration PayU Integration Zendesk Guide Integration Twilio Integration Razorpay Integration LeadSquared Integration USU(Unymira) Integration Helo(VivaConnect) Integration Salesforce KMS Integration Stripe Integration PayPal Integration CleverTap Integration Fynd Integration HubSpot Integration Magento Integration WooCommerce Integration Microsoft Dynamics 365 Integration
- Deployment
- External Agent Tool Setup
- Analytics & Reporting
- Notifications
- Commerce Plus
- Troubleshooting Guides
- Release Notes
When you are building user journeys on a bot, you can test the flows simultaneously using the Test bot section.
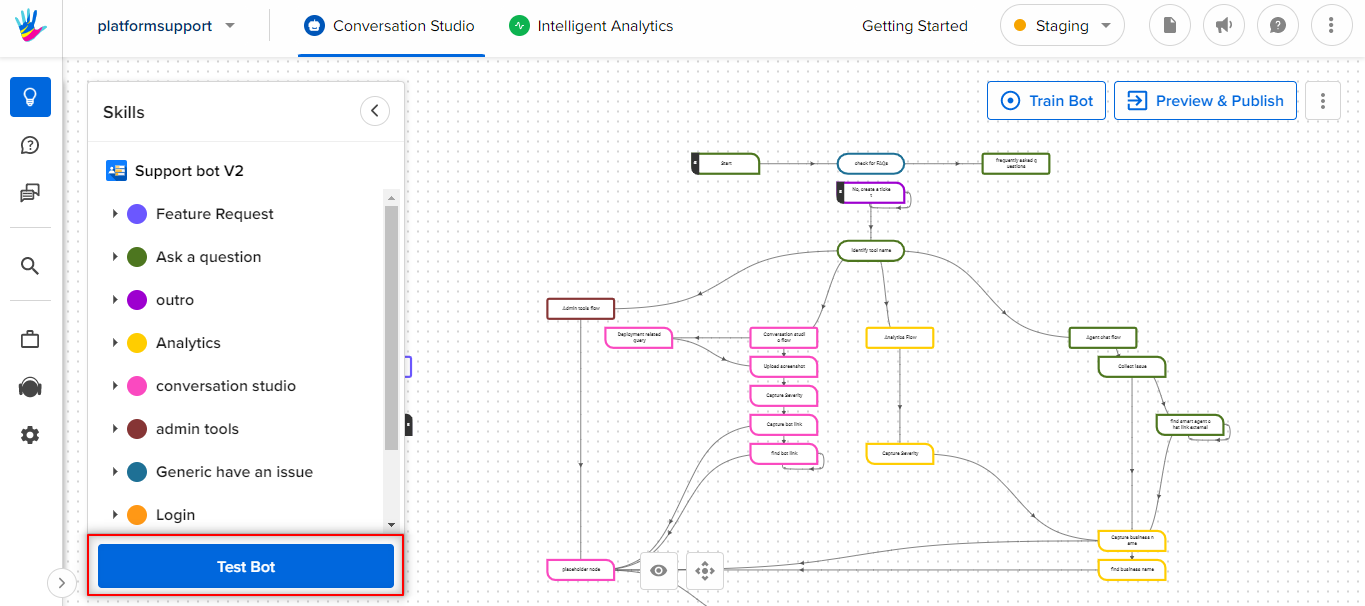
Here, in the Test Bot, you can actually test the queries on your bot and check if the bot is responding to those queries correctly or not, as shown below.
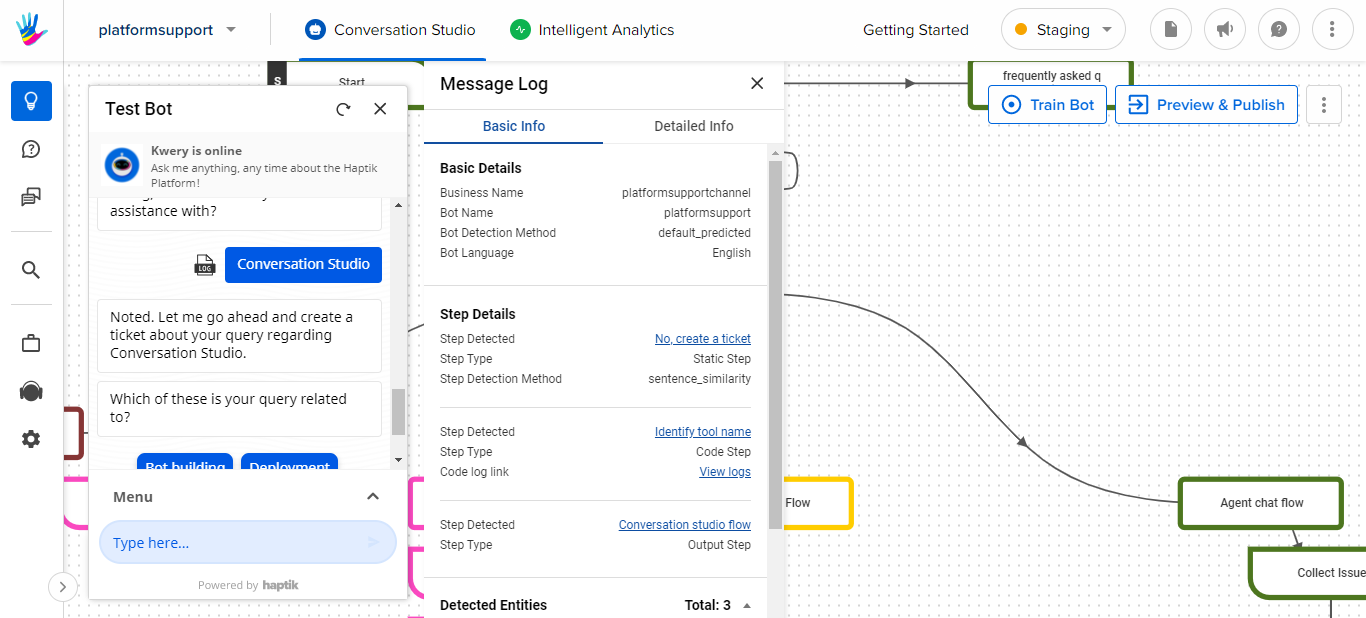
It might happen that due to some error in the code, the bot might not generate the desired result, and it would affect the bot's performance.
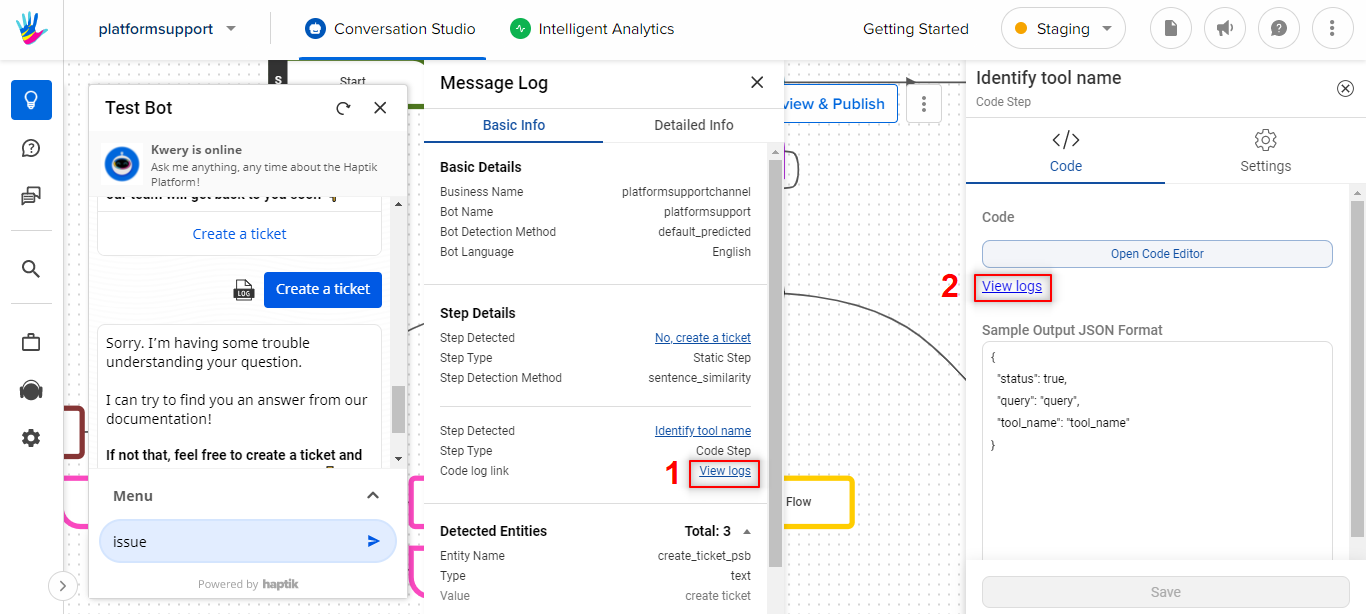
In this case, you can check the code logs, to understand where the error has occurred. You can visit the code logs in the following two ways -
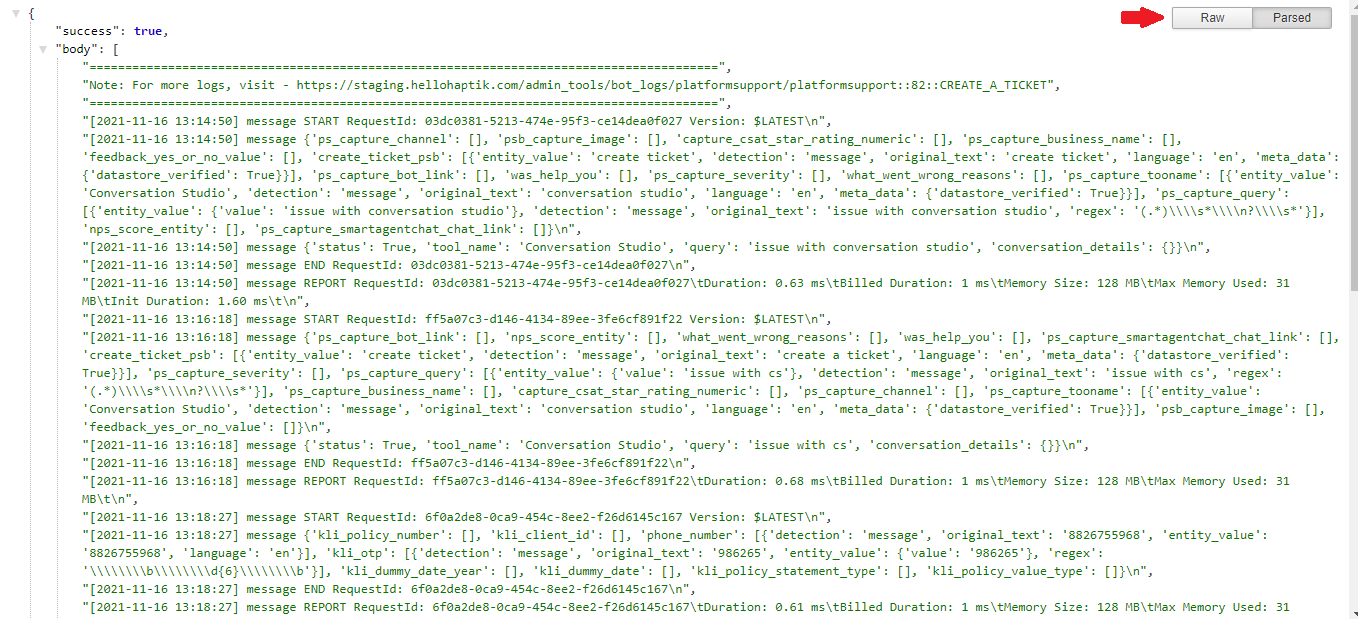
Once you open the logs, you will see the data on the screen in the following way. It is quite difficult to understand where the error has occurred.
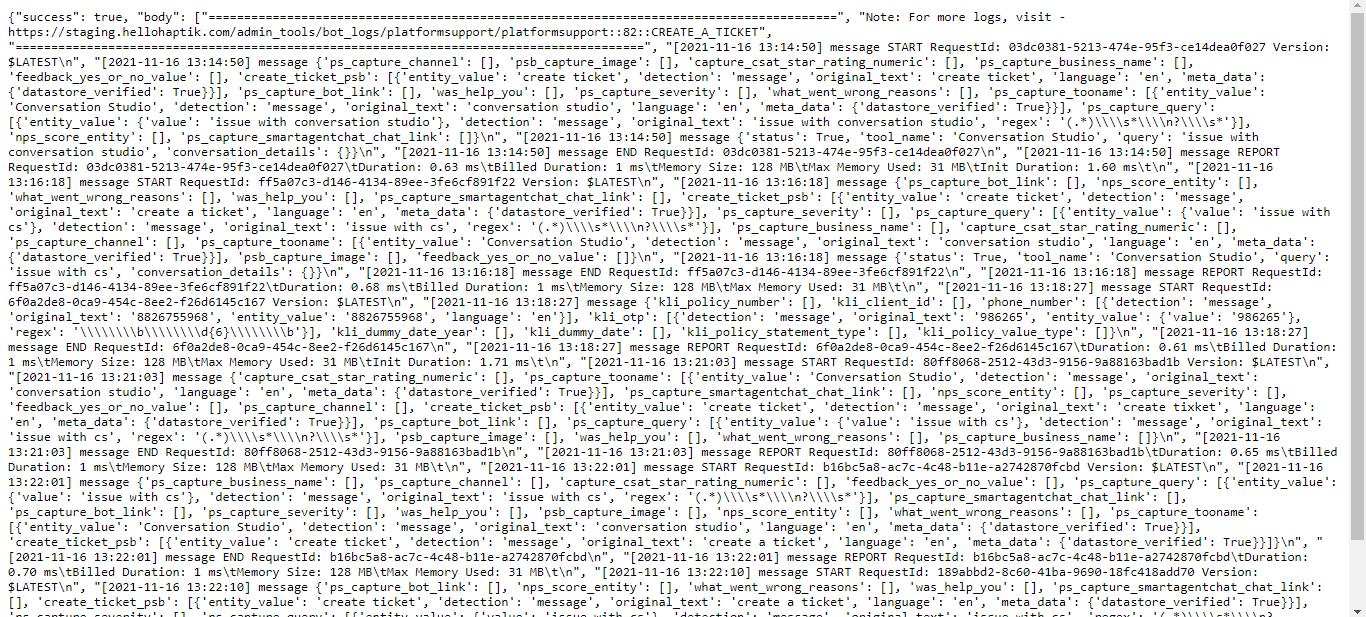
To simplify these logs, we can install the Google Chrome extension JSON Formatter.

Once you have added this extension, you can now check the logs in a more simplified way. You can choose between Raw and Parsed views. The Raw view will display the logs in the cluttered form, whereas the Parsed view will display the logs in a more structured way.
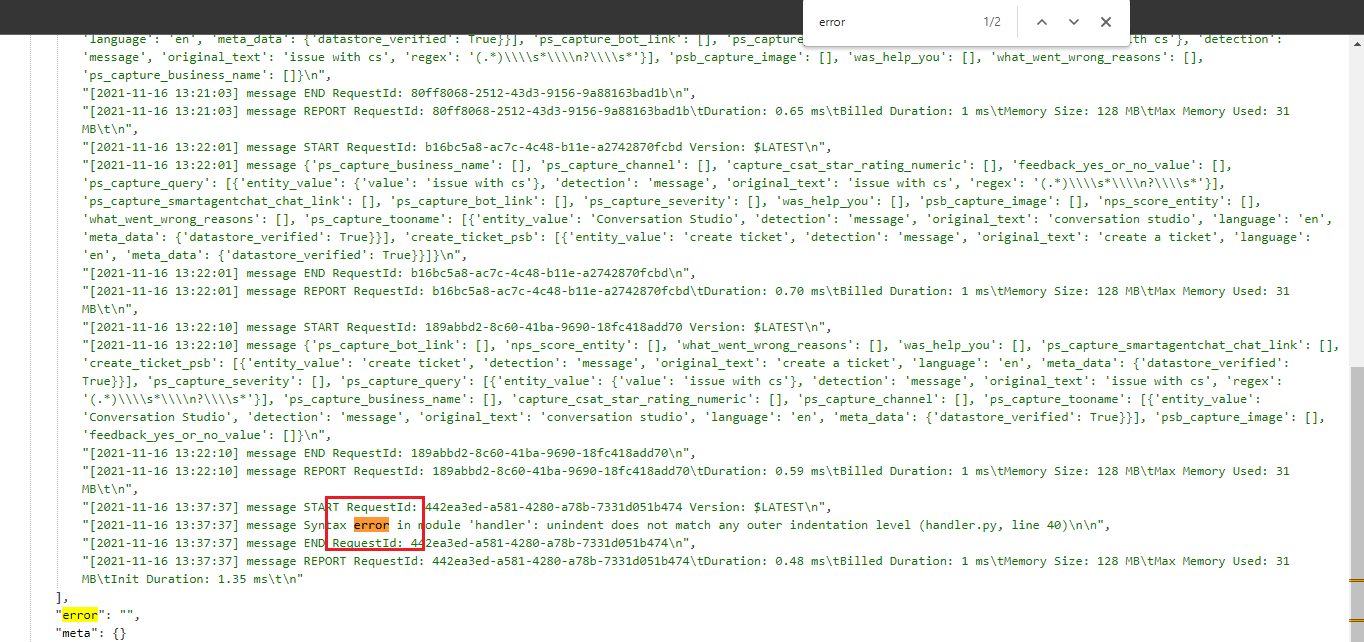
In the logs, you can simply click Ctrl+F and search error. The part where the error has occurred will get highlighted and you can rectify it in the code.
So, this is how you check the logs for the code steps.
