What are User Ratings on Intelligent Analytics?
- Getting Started
- Bot Building
- Smart Agent Chat
- Conversation Design
-
Developer Guides
Code Step Integration Static Step Integration Shopify Integration SETU Integration Exotel Integration CIBIL integration Freshdesk KMS Integration PayU Integration Zendesk Guide Integration Twilio Integration Razorpay Integration LeadSquared Integration USU(Unymira) Integration Helo(VivaConnect) Integration Salesforce KMS Integration Stripe Integration PayPal Integration CleverTap Integration Fynd Integration HubSpot Integration Magento Integration WooCommerce Integration Microsoft Dynamics 365 Integration
- Deployment
- External Agent Tool Setup
- Analytics & Reporting
- Notifications
- Commerce Plus
- Troubleshooting Guides
- Release Notes
Table of Contents
What are User Ratings?Overall Channel RatingMessage Feedback ReportUser Ratings ReportRating TrendsRating RatioAverage RatingWhat are User Ratings?
The User Ratings page of the Intelligent Analytics tool provides information about the ratings given by a user for a bot and agents(if present).

Based on the configuration made by the bot developers, a bot might ask for feedback from user at the end of a chat. The feedback it captures involves a star rating out of 5 and a free form text review or comment.
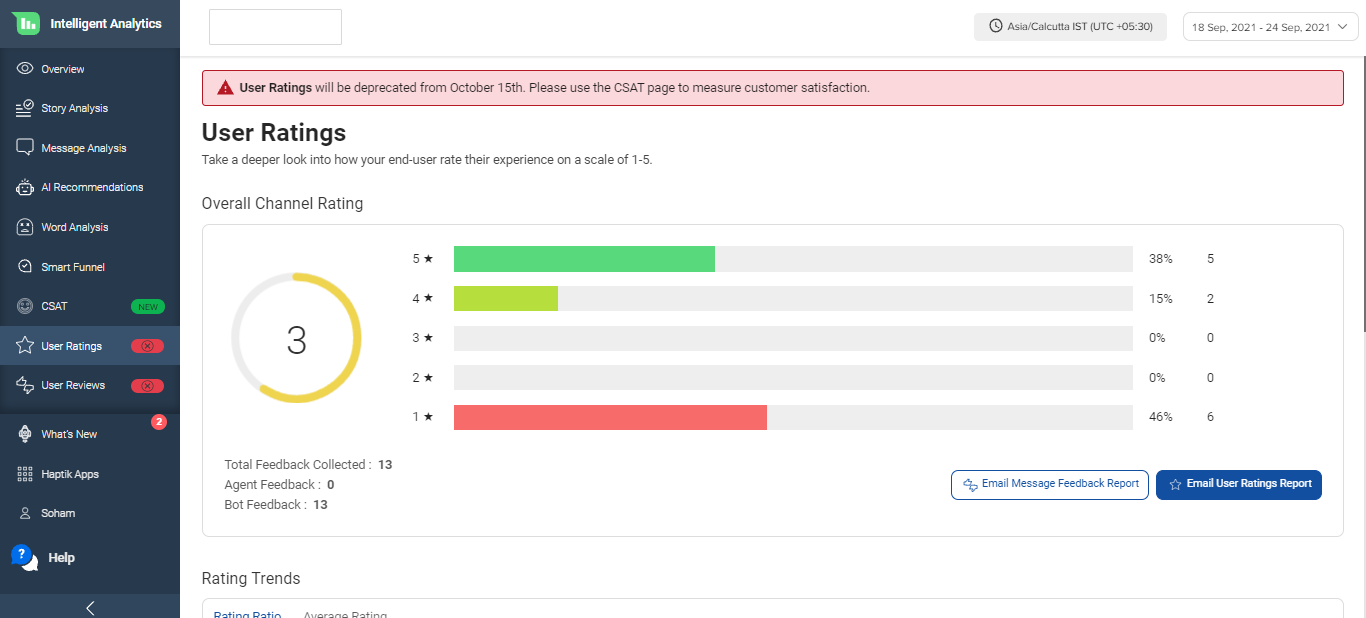
On User Ratings screen, if you hover over the average rating circle, you would see three type of average ratings -
- Overall Rating - Average of ratings received by both bot and agent combined
- Agent Rating - Average of ratings received by agent
- Bot Rating - Average of ratings received by the bot
You can see the same in the image shown below.

Overall Channel Rating
At the top of the User Rating page, you have the Overall Channel Rating. This section will show the bifurcation of ratings received on the bot. There are three types of feedback ratings -
- Total Feedback - This is the number of total feedback received both for bot and agents.
- Agent Feedback - This is the number of feedback collected for the agents i.e. when users provide feedback after conversing with agents.
- Bot Feedback - This is the number of feedback collected for the bot i.e. the overall rating provided by the users to the bot. (This feedback module kicks in when a user reaches Context Clear Step)
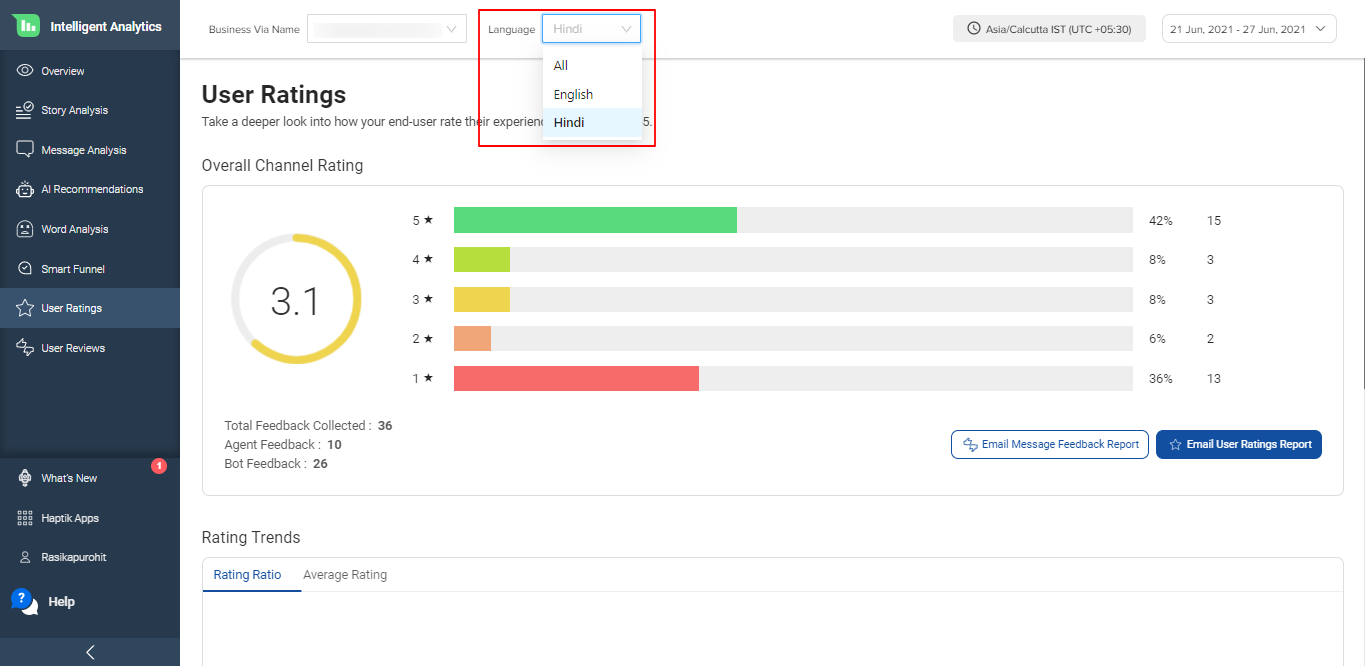
In the left corner of this section, you can see the average star rating provided by all users. Next to it, you can see the total number of people that have given a particular number of stars. For example, you can see how many users gave 5 stars, how many gave 4 stars, and so on. You can find both the percentage and an absolute number of users for any feedback.

There are two options for emailing feedback reports here.
Message Feedback Report
There is an option to collect feedback on every message sent by the bot for free form queries. You can enable the settings for per-message feedback on Business Manager.
On the Intelligent Analytics tool, you can email this feedback report by clicking on this button on the User Rating screen.

User Ratings Report
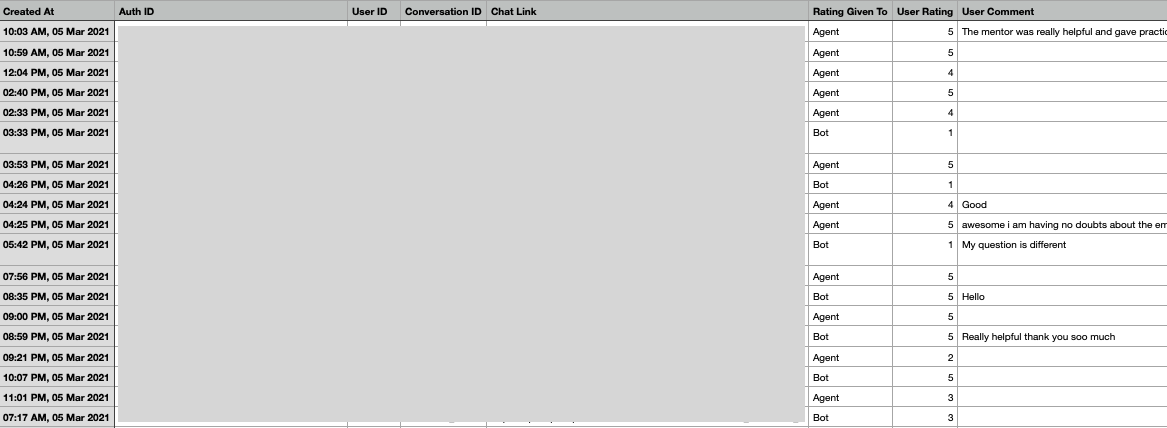
To differentiate ratings received by the bot and agents(if present), you can email this User Ratings report by clicking on the button highlighted on the below image and you will receive a password-protected CSV report over email.

The CSV report has a dedicated column Rating Given To to specify who received this rating - Bot or Agent.
Rating Trends
Below the Overall Chat Ratings, you have the Rating trends where you can see how the user ratings varied over time.
On X-axis you have the time and on Y-axis you have the total number of users that have given the rating. There are two graphs available here.
Rating Ratio
The first graph present in the Rating Trends section is called Rating Ratio. Here an area graph is used to show the split of users giving different levels of ratings over a period of time.
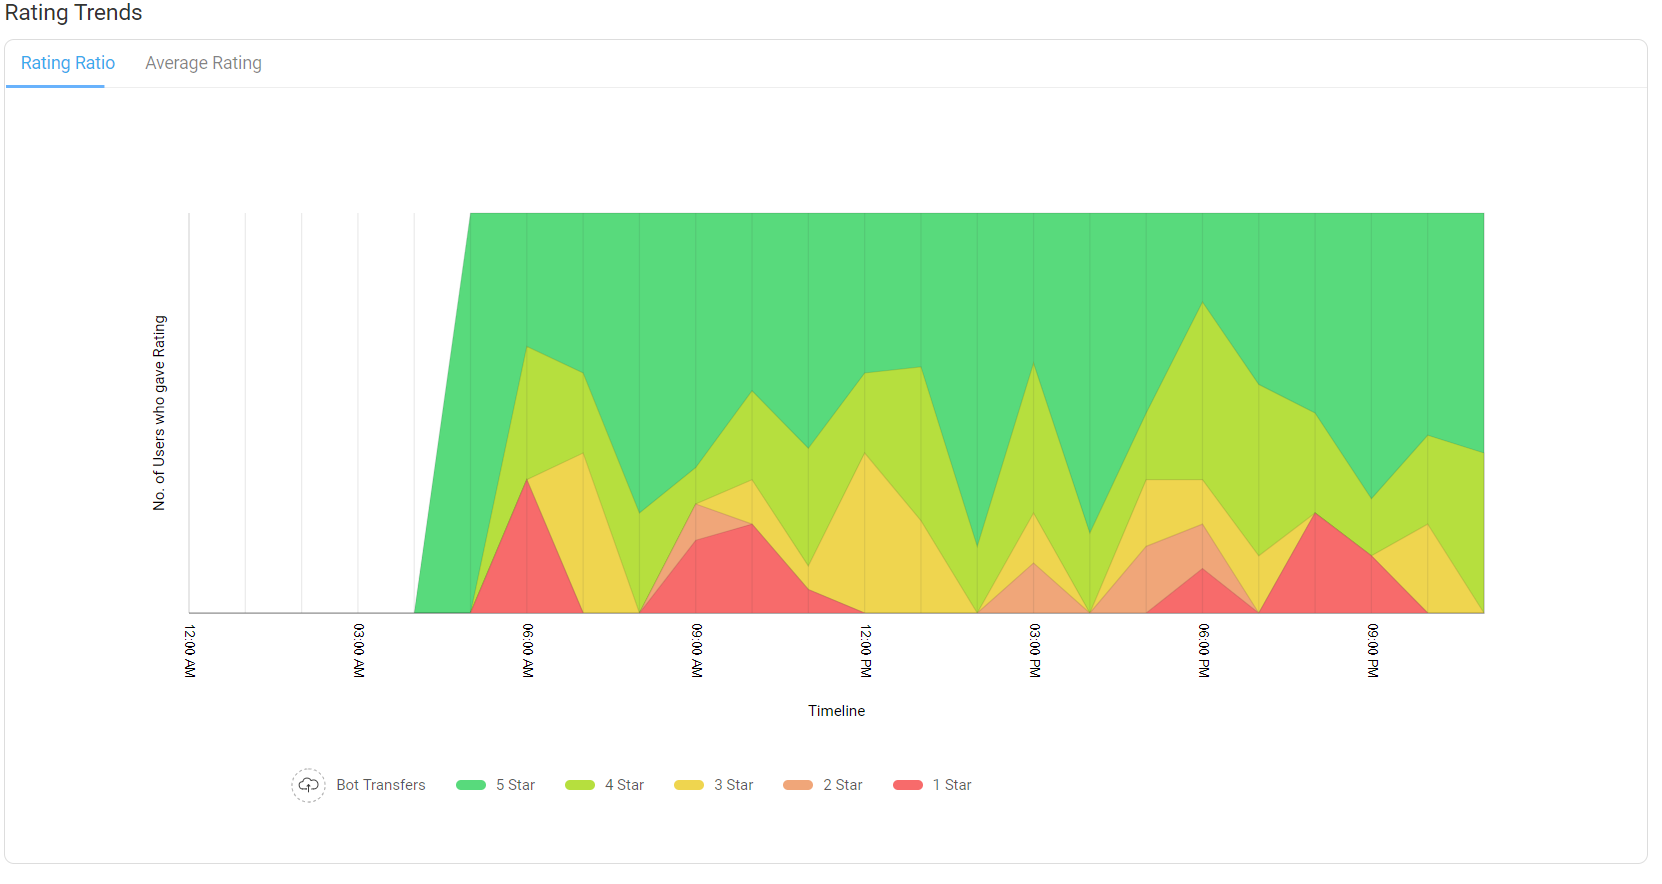
The legends at the bottom of the graph show you the color relating to each of the different rating levels.
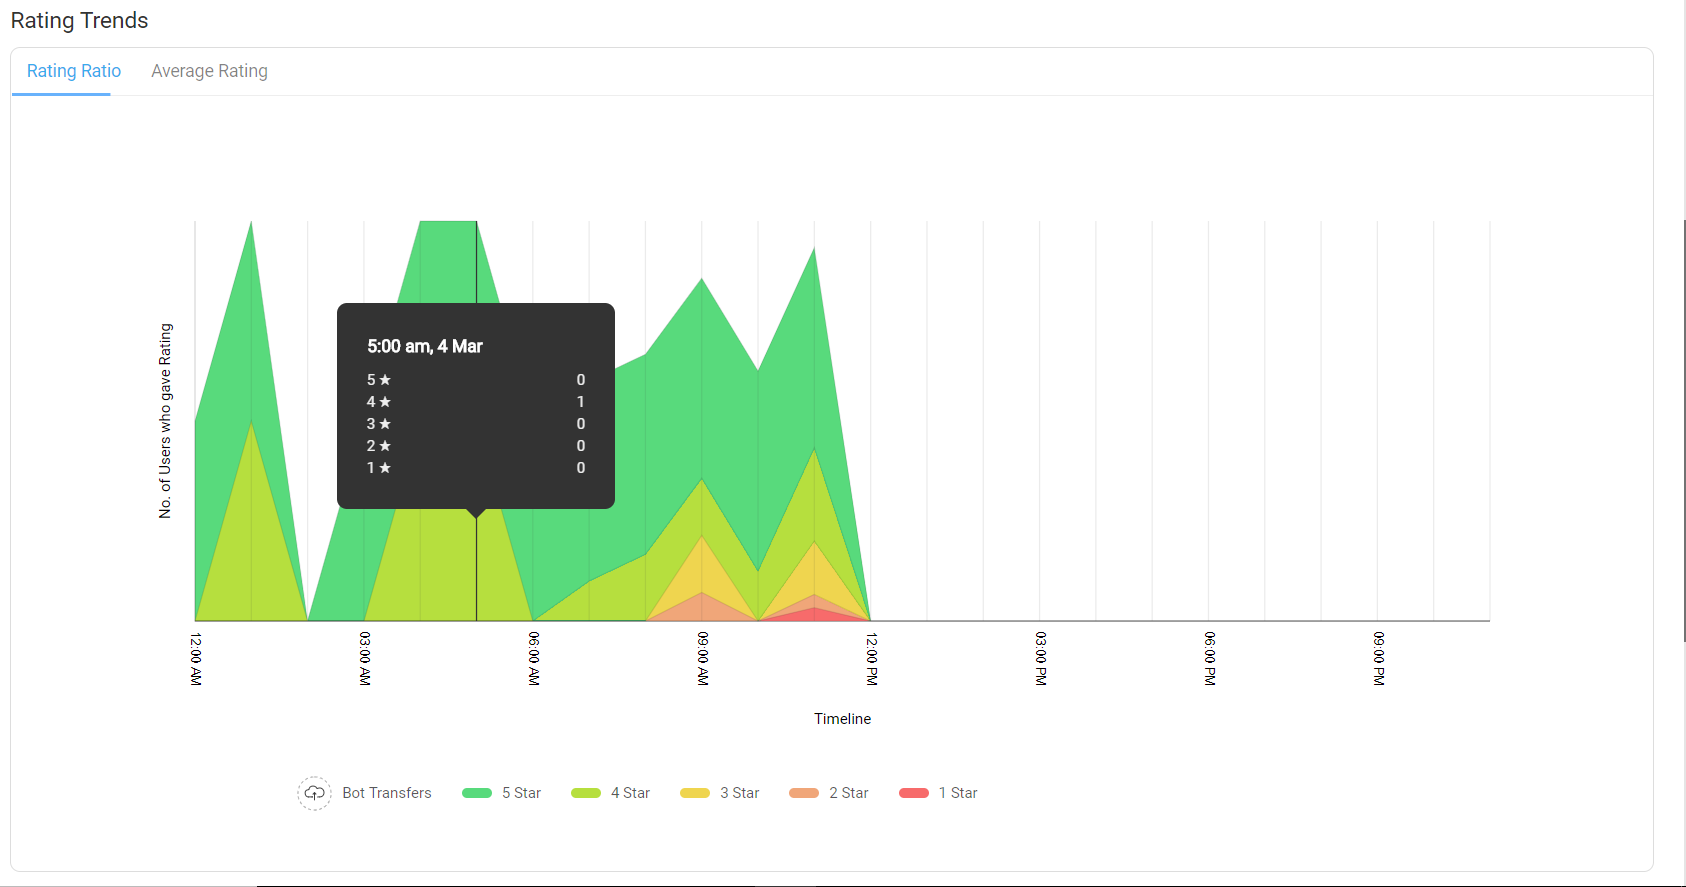
You can get more detailed information about the user ratings at any given time by hovering on the graph.
Average Rating
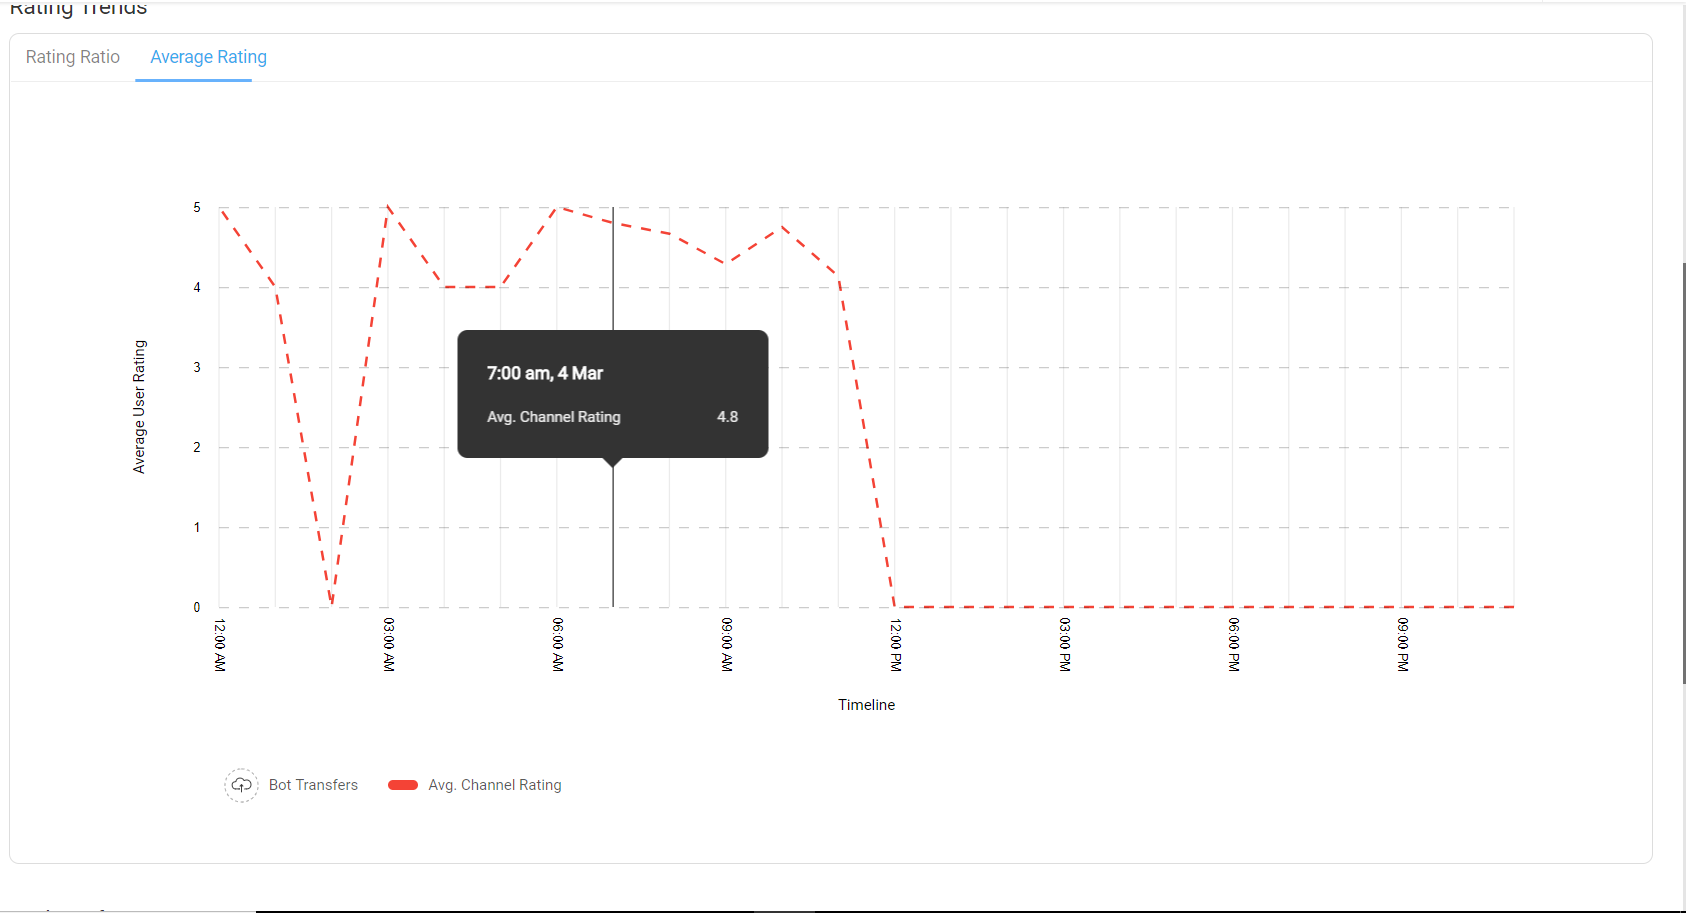
The second graph is the Average Rating where instead of showing the trend of all the levels of rating, you can see the trend of average rating over a period of time.
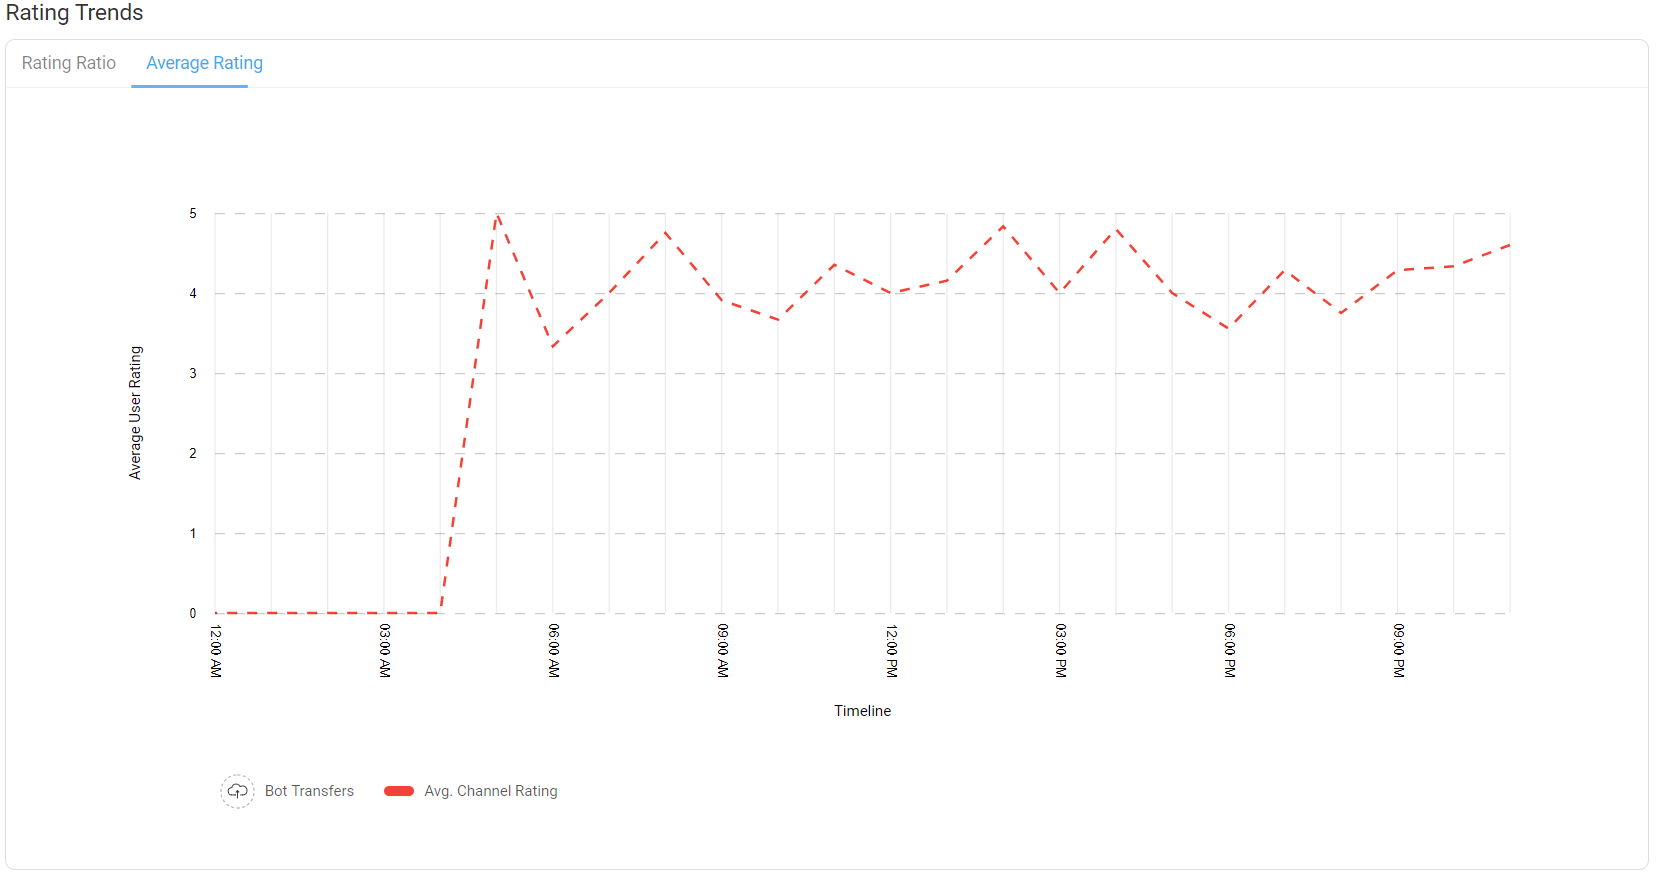
At the bottom of the graph you can see a legend explaining that the red line indicates the average rating given by the user.
Similar to the previous graph you can view the specific average rating at any point of time by hovering on the graph.
