What are the different metrics related to a bot?

Written by Medha Anand
Updated on August 26th, 2022
- Getting Started
- Bot Building
- Smart Agent Chat
- Conversation Design
-
Developer Guides
Code Step Integration Static Step Integration Shopify Integration SETU Integration Exotel Integration CIBIL integration Freshdesk KMS Integration PayU Integration Zendesk Guide Integration Twilio Integration Razorpay Integration LeadSquared Integration USU(Unymira) Integration Helo(VivaConnect) Integration Salesforce KMS Integration Stripe Integration PayPal Integration CleverTap Integration Fynd Integration HubSpot Integration Magento Integration WooCommerce Integration Microsoft Dynamics 365 Integration
- Deployment
- External Agent Tool Setup
- Analytics & Reporting
- Notifications
- Commerce Plus
- Troubleshooting Guides
- Release Notes
Table of Contents
Table of Contents
IntroductionUnique UsersCSATQuery CompletionConversationsTop FunnelsBot AutomationLanguage UsageConversation SplitDemo DataIntroduction
The first section in the Intelligent Analytics tool is the Overview section. As the name suggests, this section helps you get a quick overview of the important metrics to measure the IVA's performance.
The Overview section provides information about:
- Unique Users
- CSAT
- Query Completion
- Conversations
- Top Funnels
- Bot Automation
- Language Usage
- Conversation Split
Business Name

On top of all screens inside the Intelligent Analytics tool, you will find the business options. This option helps you select the business name from the dropdown for which you want to analyze the data.
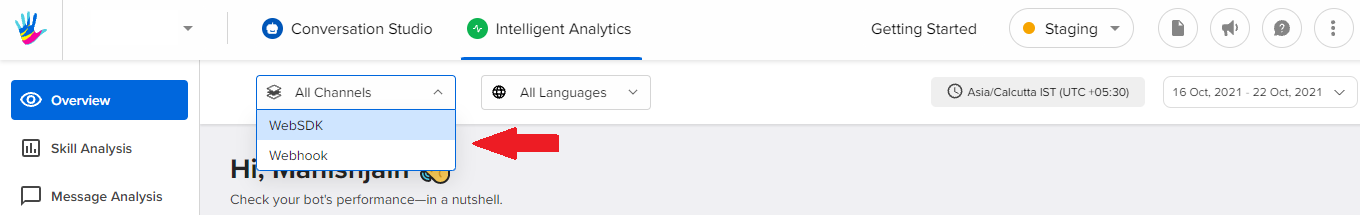
Filter by Channel
This option would enable you to see the channel, on which your bot is deployed. Upon selecting the channel, you will be able to see the analytics for the same.
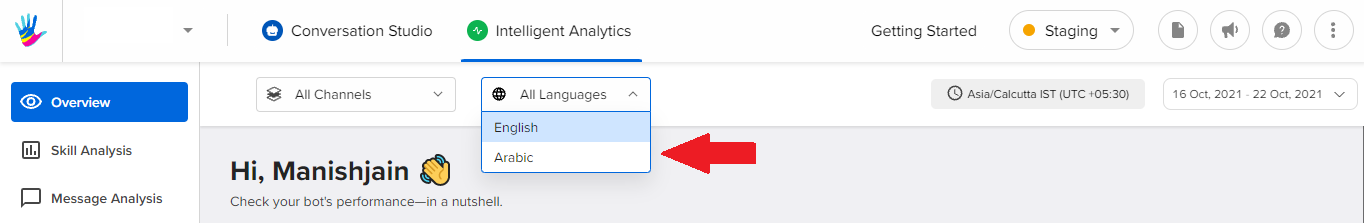
Filter by Language
This option would enable you to select the language, on which your bot is deployed. Upon selecting the language, you will be able to see the analytics, specific to the language you select.
Timezone

The tool will identify your timezone to analyze the data.
Duration
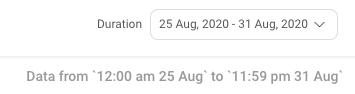
On the right-hand side of the filter section, you will find the duration filters. Using these settings you can filter the time period of the data presented.
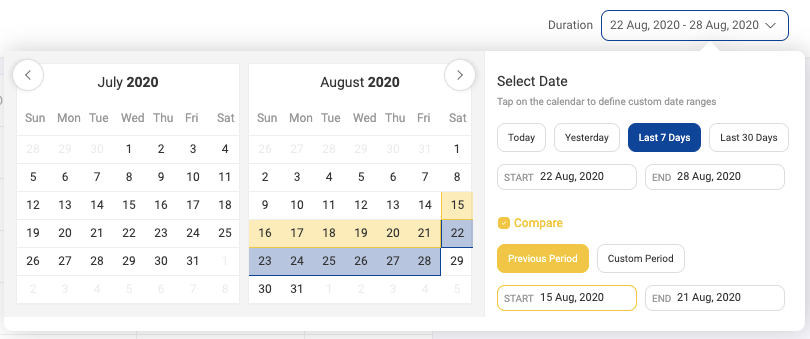
There is a compare feature available that will help you to compare the performance of all metrics between the selected duration and its previous duration.
Unique Users
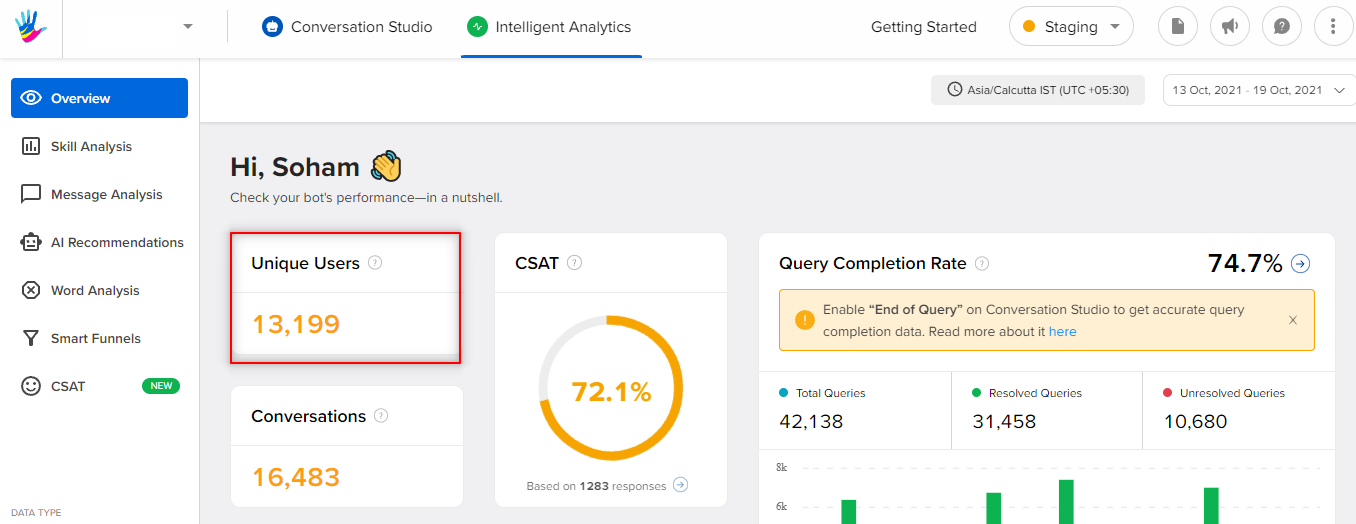
The first section in the overview section is the number of users who have conversed on the bot in the given duration period. On hovering over the number, you will be able to check the actual number of new users and the number of returning users i.e., repeat users.
What are unique users?
Unique Users refer to the number of unique individuals who have visited your bot over a period of time. As the name indicates, the number of visits per user does not affect this count.
Eg. If Mary visits the bot on Tuesday, Wednesday and Thursday, the unique user count will be displayed as 1. It does not increase by 3 as Mary is one ‘unique’ user.
What are New vs Repeat users?
- New users are users who are visiting your bot for the first time and have never been to your bot previously.
- Repeat users are users who have interacted with your bot before and have come back again.
CSAT
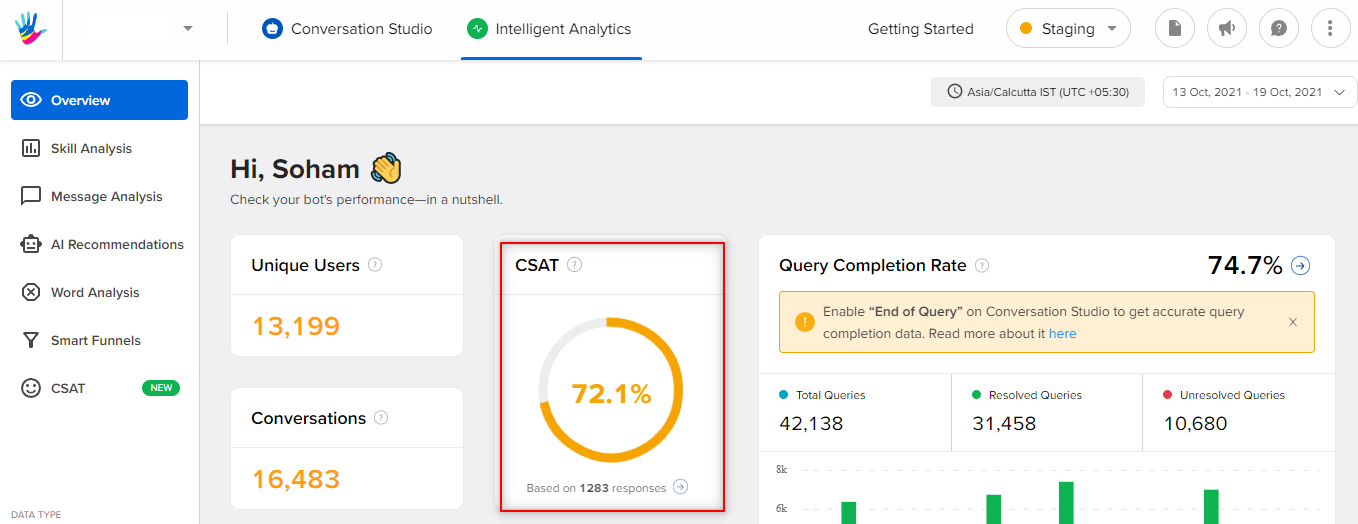 CSAT Stands for Customer Satisfaction Score. This key performance indicator tracks how satisfied are the customers with the service.
How is CSAT Calculated?
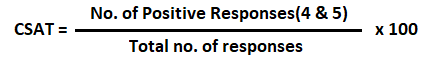 For example, if you have 35 positive responses (4 and 5) and a total of 50 responses, your CSAT would be 70%.
The following colors are used to show the benchmarks of CSAT -
- Green - 80% and Above
- Orange - 70-80%
- Red - Below 70%

You can learn more about CSAT here.
Query Completion
Query Completion helps to track whether the bot is helping the end-user to resolve. A user's query is resolved on the bot when the user goes through the designed bot's journey and reaches the end of the journey.
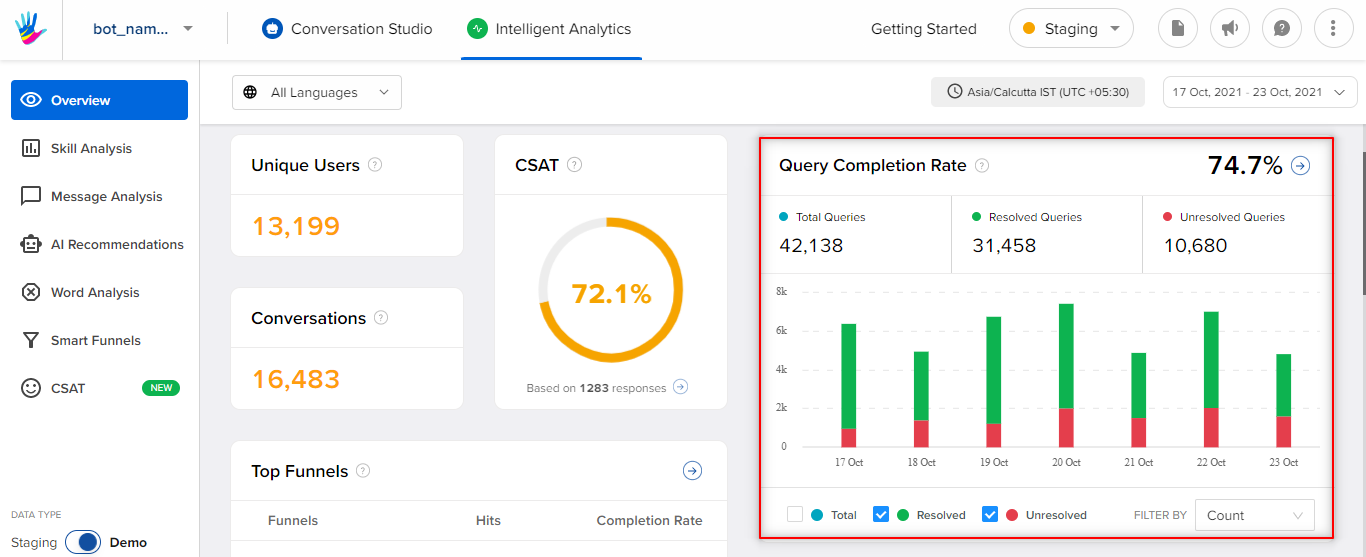
To learn more about Query completion, click here.
Conversations
A conversation is defined as a series of messages exchanged between the IVA and the user in a 24-hour window, from the time user sent the first message on the bot.
- Bot state: In the bot state, the conversation is closed after 24-hours from the time the conversation was initiated by the user. You can re ad more about it, here.
- Agent state: In the agent state, the conversation is closed by an agent if the query is resolved or the user has been inactive, and then the conversation moves to the bot state where it is closed after 24-hours from the time it was initiated by the user.
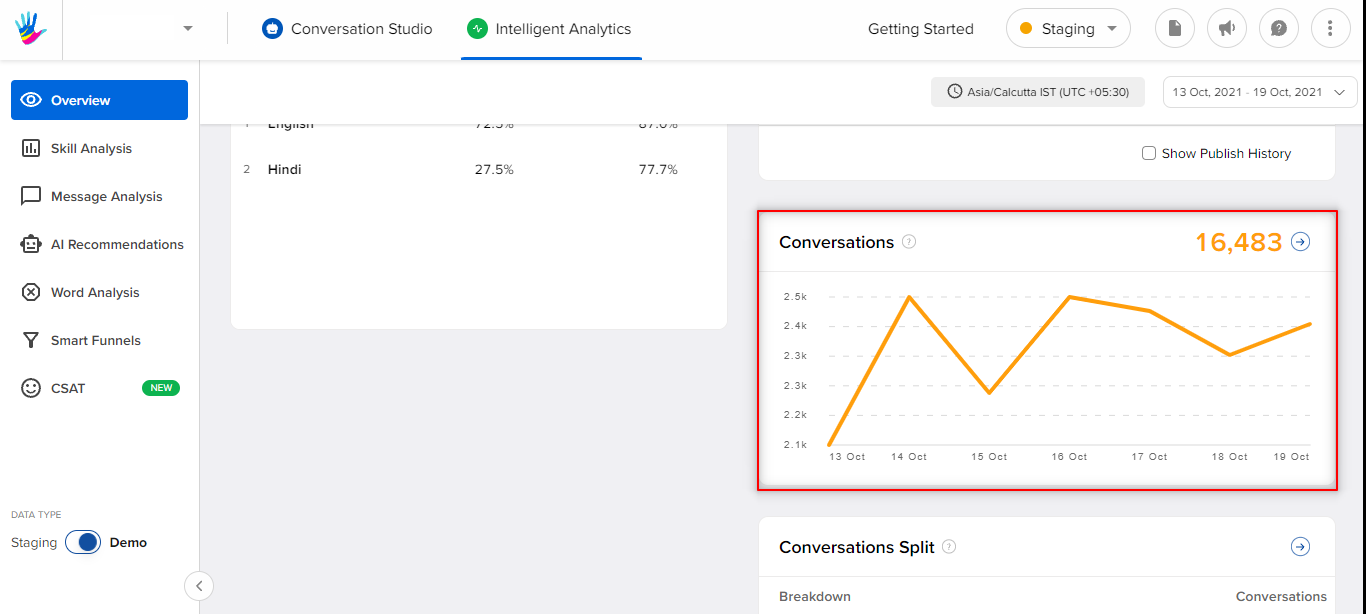
To learn more about Conversations, click here.
Top Funnels
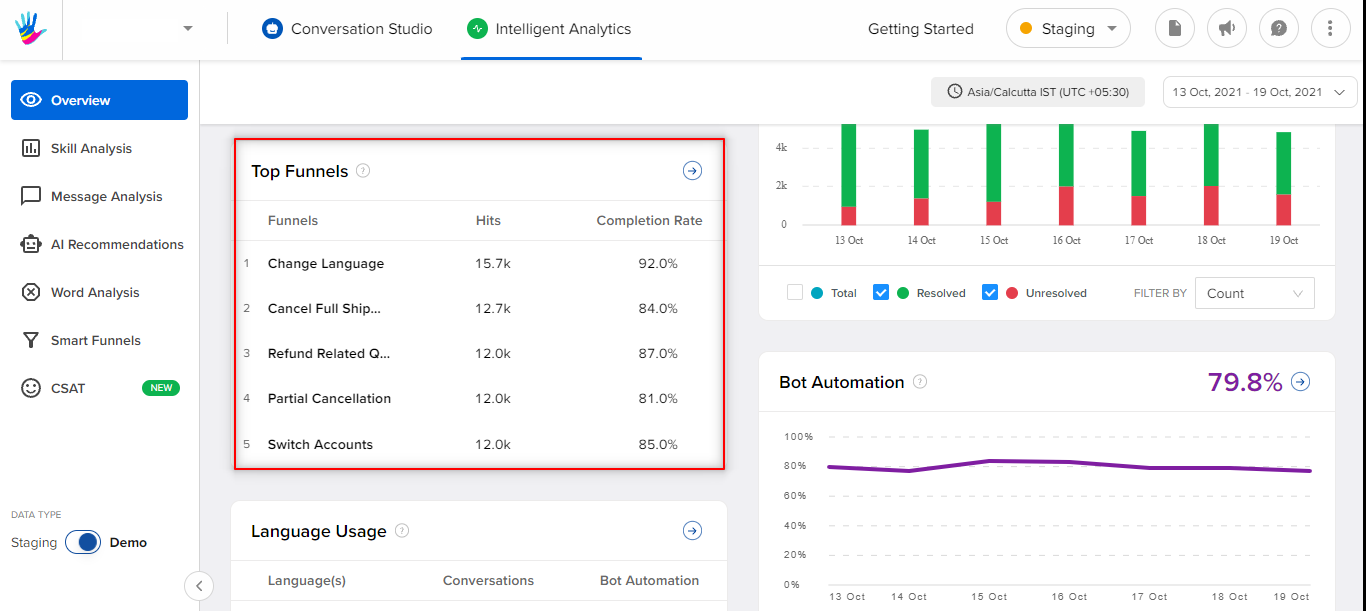 This section gives the first 5 funnels as per volume coming on the bot.
Along with the funnel name, funnel hits and completion rate are also shown.
You can learn more about Funnels here.
Bot Automation
Bot Automation percentage tells us about what percentage of the conversations did not have either a bot break or an agent involved for the selected duration of time.
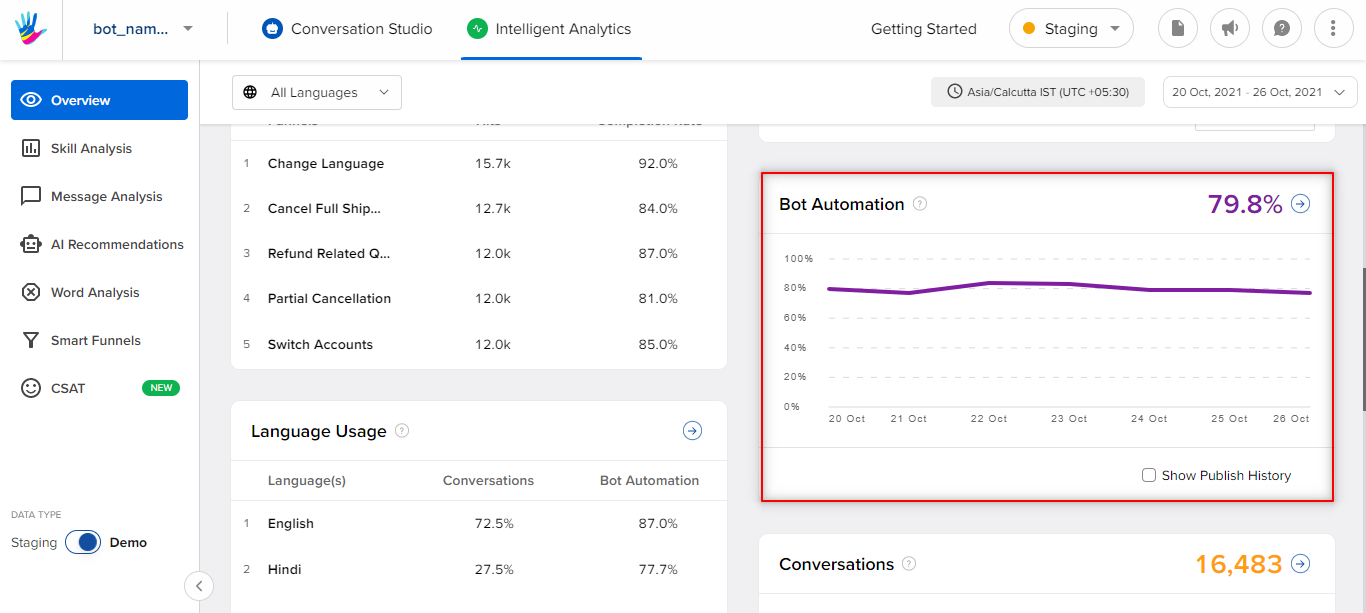
To learn more about Bot automation, click here.
Language Usage
Language Usage shows the split of languages, conversations, and bot automation percentage for all the languages users are interacting in, on the IVA. This section helps in understanding capabilities that should be added to support end-users who reach out in different languages.
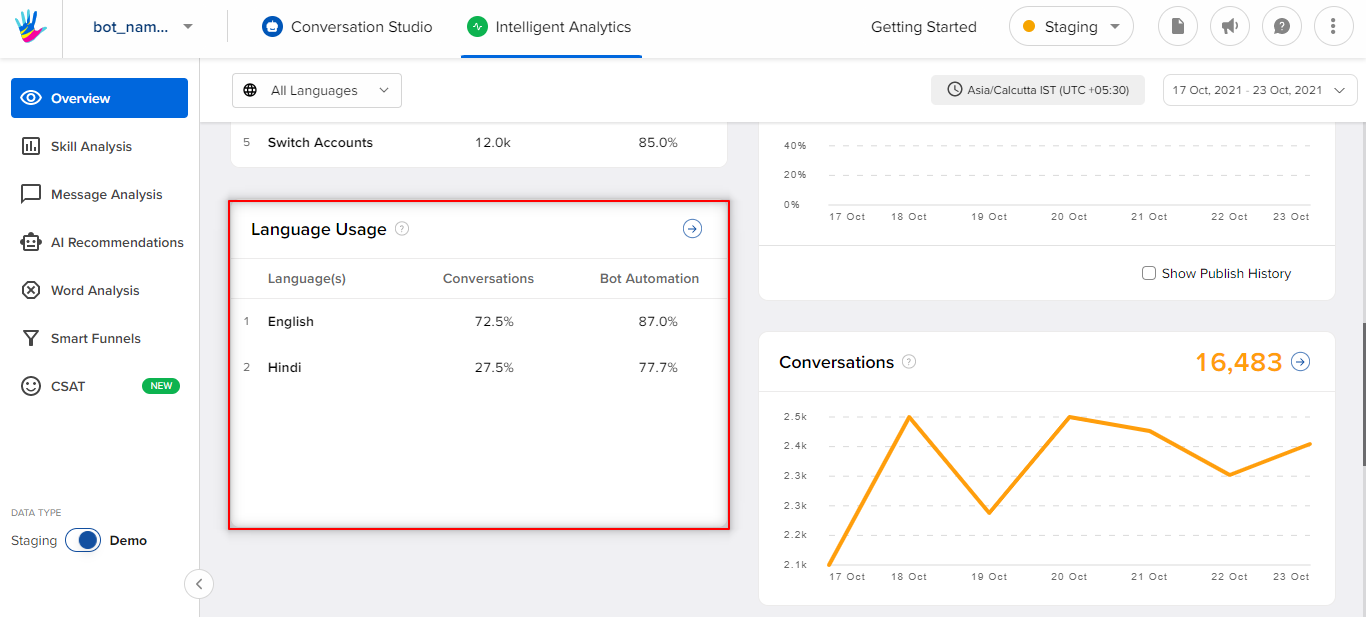
To learn more about Language Usage, click here.
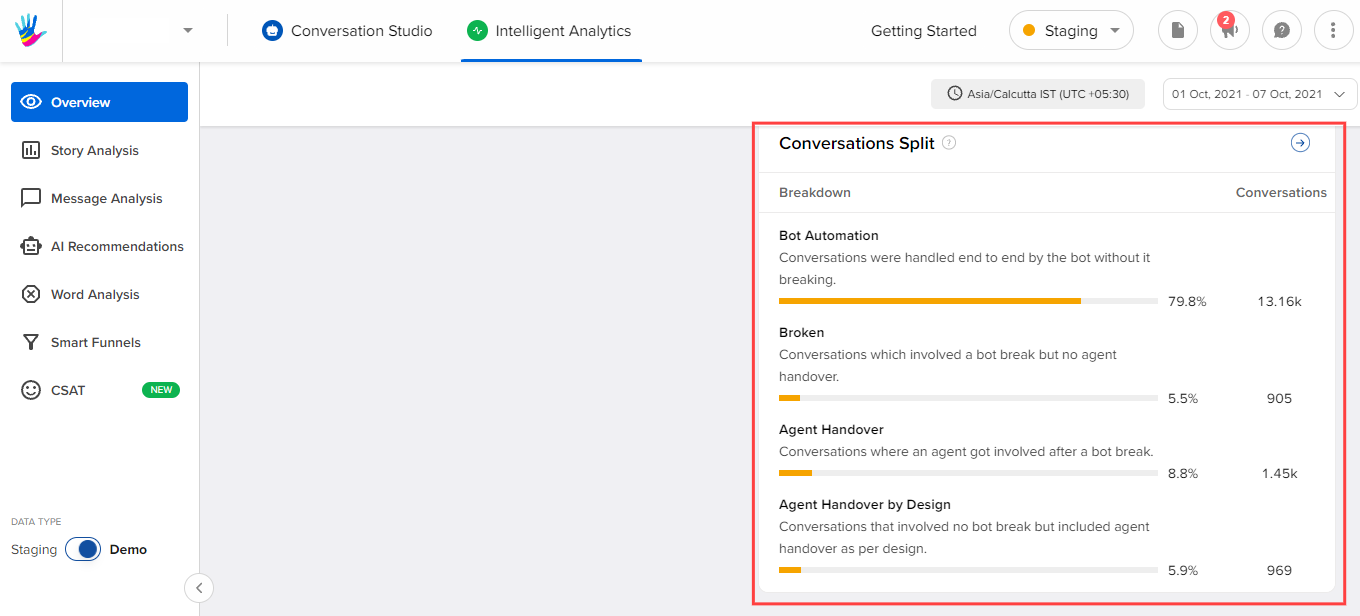
Conversation Split
The Conversation Split metrics will help you understand which conversations are broken and which are being handed over to agents for live support.
- It could be used to uncover root causes of deflection to the call center or agent live chat tool.
- It could be used to identify opportunities for further automation, allowing customers to skip the agent and instead self-serve, to get their answers by automating top asked queries, finding new data sources, or training sets for improving the performance.
You can read about it in more detail here.
Demo Data
Demo data is the data shown for demonstration purposes. When you create a new bot, it won't have any data to show on Analytics because there has been no activity of users on it. If you want to understand what each metric stands for, and how can they be used with some real data examples, you can use the demo data toggle.
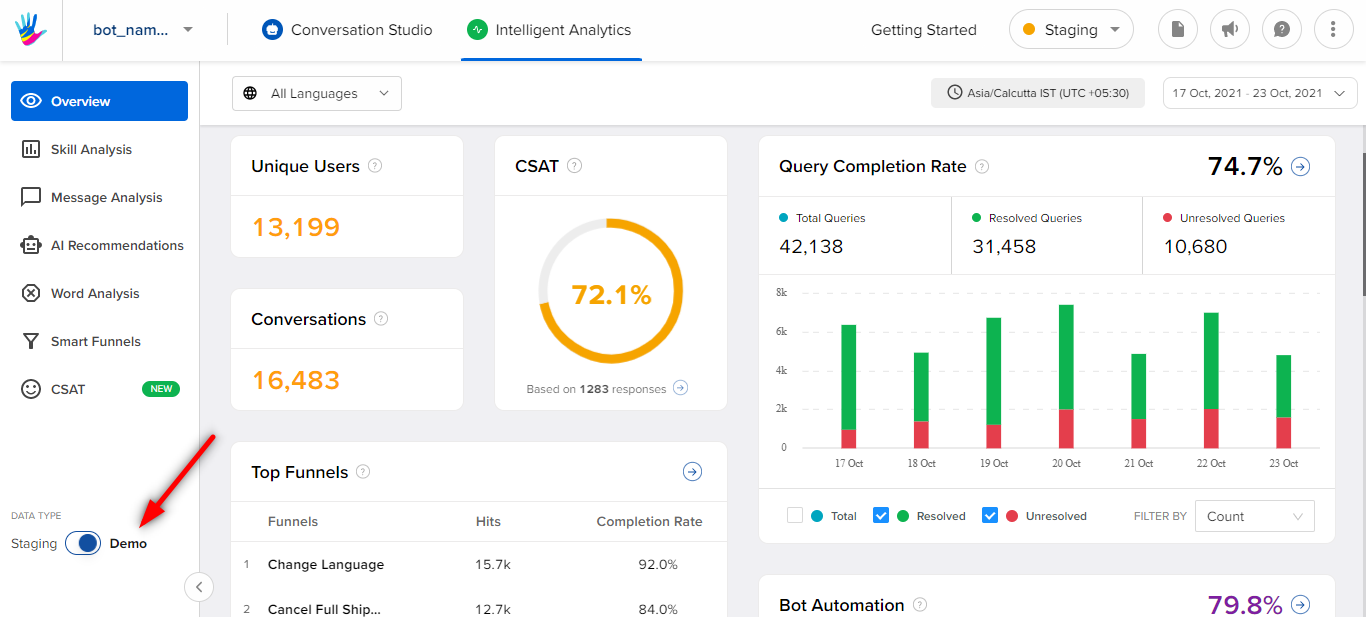
To learn more about demo data, click here.
